How to Build an Analytics Software: Comprehensive Guide 2024
Published: – Updated:
If we had to describe what data analytics application development looks like, we would say that it’s similar to pulling out the Excalibur from the stone. But we will not dramatize to this extent. On the contrary, with the right strategy towards the product creation, a properly chosen software vendor, and an efficient tech stack, the challenging part related to its creation will fade away. Thus, this article examines the working principles of an analytics platform, the benefits of this solution, and provides technical tips for developing a competitive product.
Business intelligence: why it matters
BI (business intelligence) is far from being a recently emerged phenomenon. Instead, it’s a scope of approaches, practices, and technologies that has undergone a long path of transformations and adaptations to the market changes. Contemporary BI encompasses numerous components that can help organizations boost their performance. But why does BI attract so much attention?
The thing is, the companies that deal with the data collection, processing, storage, and analysis require robust technology and a modern approach that will help them complete all these stages seamlessly. The absence of a BI strategy may often lead to a lack of thorough data analysis, data structuring and retrieval problems, inefficient sales, poor customer experience, etc. Thus, a correctly chosen BI methodology is highly advisable for those organizations that rely on data heavily and need to streamline the existing business strategy based on the gathered insights.
BI is a multi-faceted phenomenon that consists of the following structural components:
- Data warehousing serves as a repository for historical data that collects it from different heterogeneous sources and processes and prepares it for further analytical reporting.
- OLAP (Online Analytical Processing) is a set of software tools designed to rapidly analyze large volumes of multidimensional data in the data warehouse. It also enables managers and analysts with a simplified and fast way of retrieving and interacting with data, sorting, and selecting data clusters for their further monitoring.
- Advanced analytics is one of the most robust BI options. It’s not a homogeneous solution; instead, it integrates various data sources within the enterprise and offers specialists a vast toolset for data ingestion, processing, visualization, reporting, etc.
- Real-time BI is another business intelligence solution that helps businesses retrieve the most accurate up-to-the-minute data and transform into valuable insights so that companies could find more business opportunities and improve their instant data-driven decisions.
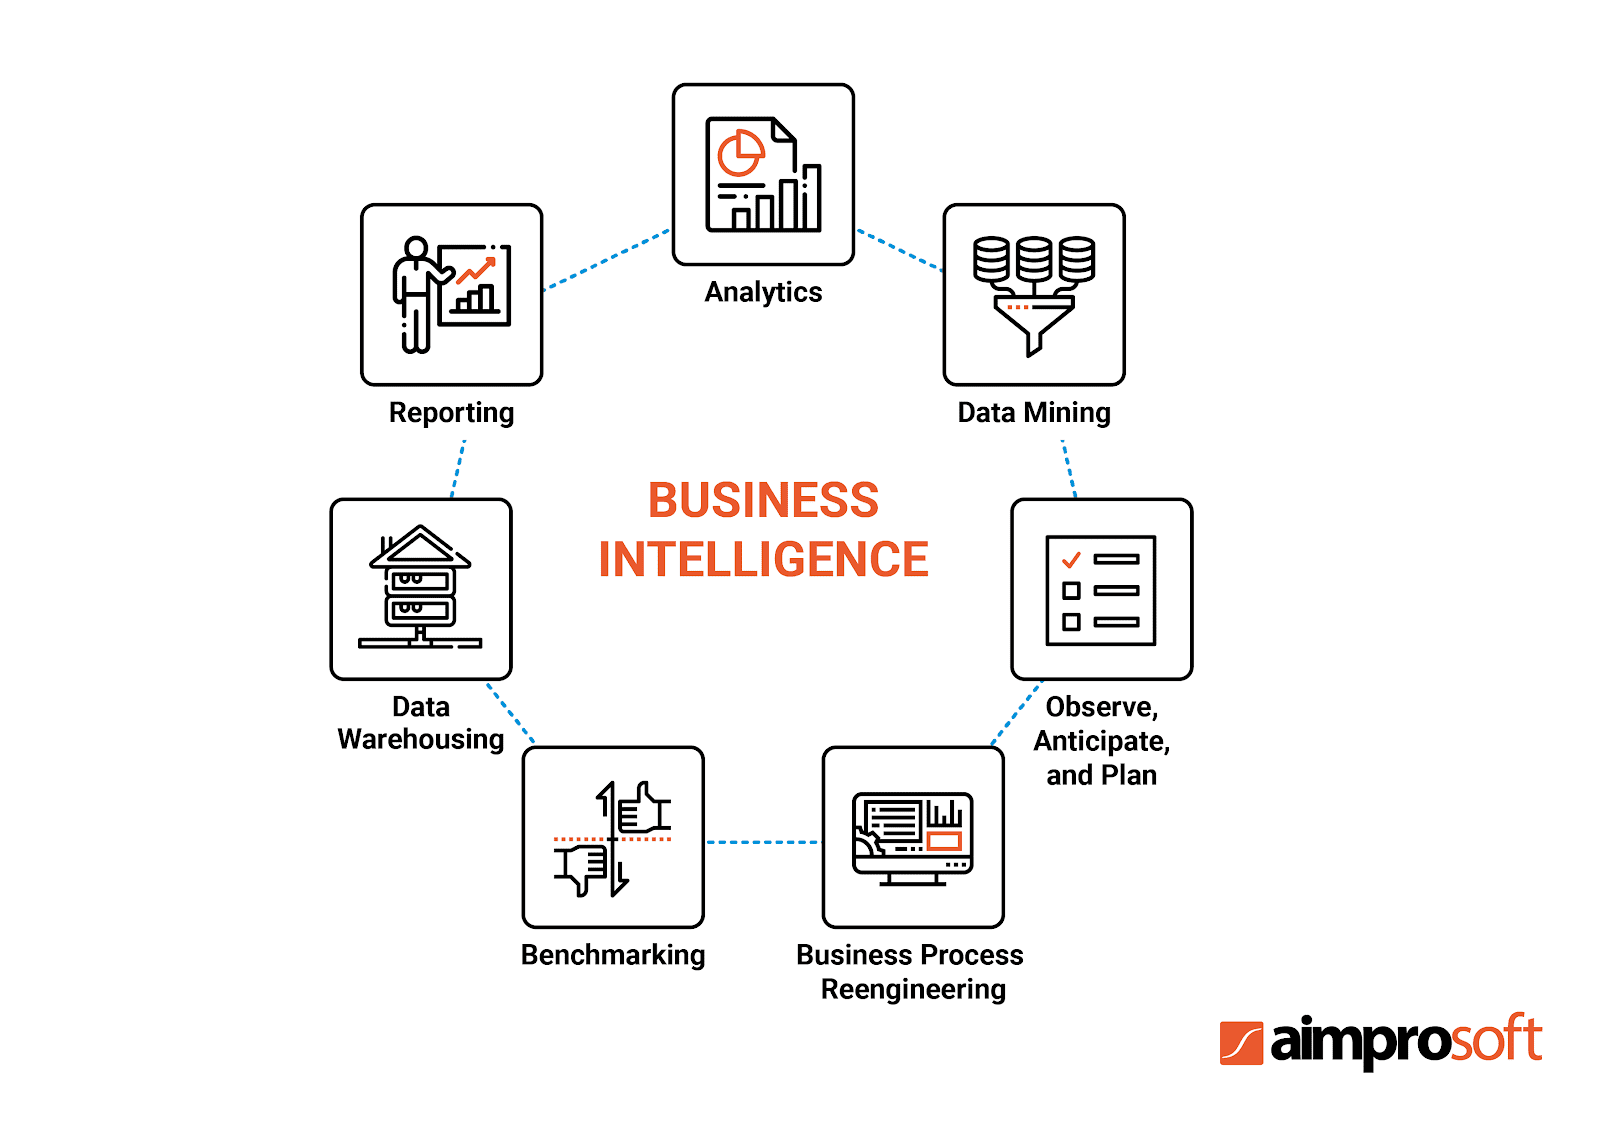
BI covers a large set of approaches and solutions and isn’t limited to the components examined above. Having completed a general overview of the business intelligence ecosystem’s main elements, let’s move on to analyzing one of its major tools, namely, the analytics platform.
Reasons of inefficient data analytics
Numerous red flags can help businesses identify they lack a proper analytics system. Thus, continue reading this section to know more about the major challenges the organizations face without a highly-functional analytics platform.
- Weak data management from different sources
Numerous businesses may have multiple streaming external and internal data sources, such as CRM systems, web applications, databases, ERPs, workflow management systems, etc. The growth in the number of disparate data sources within the company without a unified place for their management can lead to poor data analytics, data invisibility, and insufficient data governance. Moreover, such poor data management results in tiresome structuring of data.
- The company’s reports are often outdated and delayed
The absence of dynamic reporting may often lead to an inability to analyze the company’s performance on deeper levels and figure out which areas are lagging and which are performing above expectations. The importance of regular and accurate reports is high for all executives because a weak reporting system may affect critical business decisions and, as a result, lead to customers’ dissatisfaction and an increase in customer churn.
- Data inconsistency due to poor storage management
Data inconsistency, loss, unnecessary duplication, etc., may be the result of increasing the growth of data volume within the organization and weak data storage management. The companies that lack such solutions may face the problems of storing structured and unstructured data of different formats and from multiple sources.
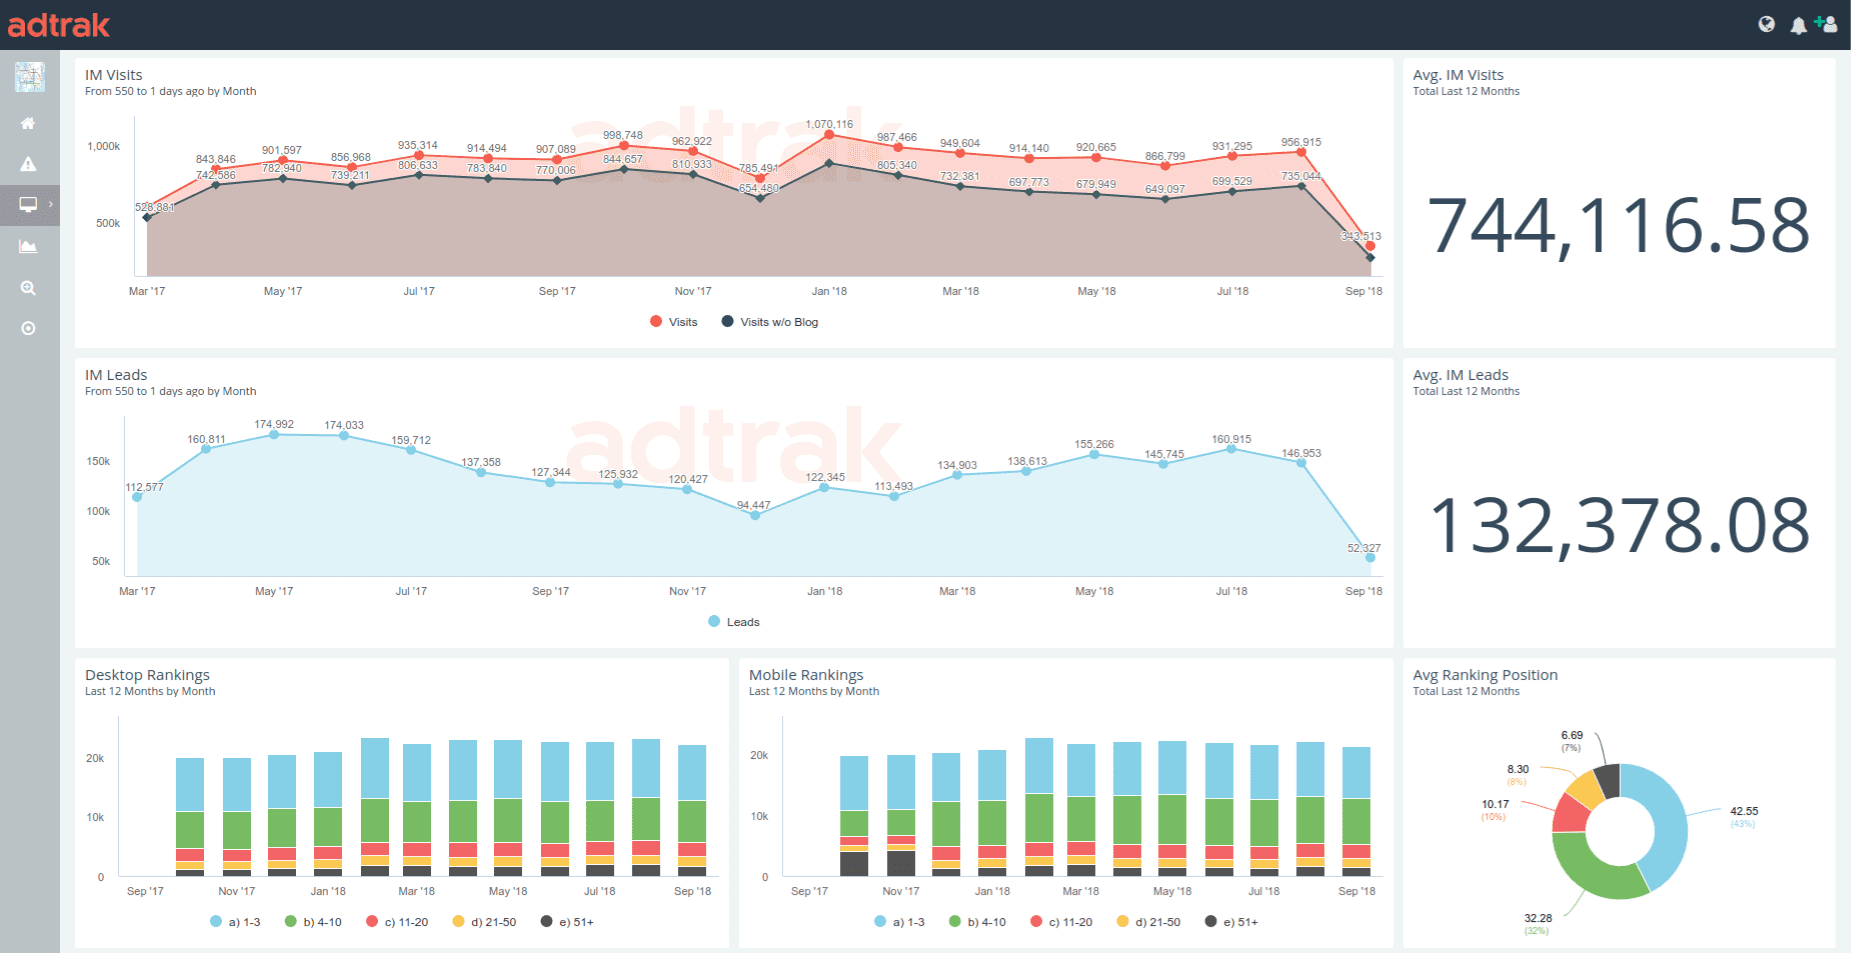
- Absence of a unified place for data visualization
The absence of a multi-faceted dashboard for performance monitoring is another reason for inefficient analytics. The companies with constant data streams from multiple data sources may often need to find real-time information regarding the company’s KPIs (critical performance indicators), accurate statistics from a particular department, etc. The lack of a centralized place for visual data presentation may result in an inaccurate understanding of vital metrics, inability to correspond to the emerging trends, and react timely to the alerts.
Thus, businesses can identify inefficient data analytics with certain indicators. Luckily, it’s not the end of the world, and every possible challenge can be solved with a particular feature of a full-fledged analytics platform that we will consider in the section below.
Main advantages of analytics platforms
This technology is a perfect merge of key components inherent to BI. Analytics platforms embrace various tools for data integration, gathering, processing, and presentation, helping businesses make more accurate business decisions. This type of software enables companies to integrate their data from multiple data sources, cover the entire data life-cycle, visualize it conveniently, and so on. Thus, let’s take a look at the main benefits of building a data analytics platform.
- Efficient data management
The analytics platform is one of the most convenient BI options for efficient data management. It makes sure that the data can be easily accessed and retrieved from all company’s repositories and then structured for quick analysis.
- Scalability
Scalability By building a data analytics platform, you will ensure that increasing volumes of data are properly handled without the necessity to sacrifice the system’s performance.
- Actionable insights
The platform helps monitor all the customers’ interactions with the provided services or products: how they scroll through the site, reasons why they make certain purchasing decisions, the point when they leave the site, etc. It enables business owners to retrieve more accurate and valuable insights based on gathered sets of data. The obtained business insights can help create more powerful marketing campaigns, improve customer experience, personalize it, and engage new users.
- Better data representation
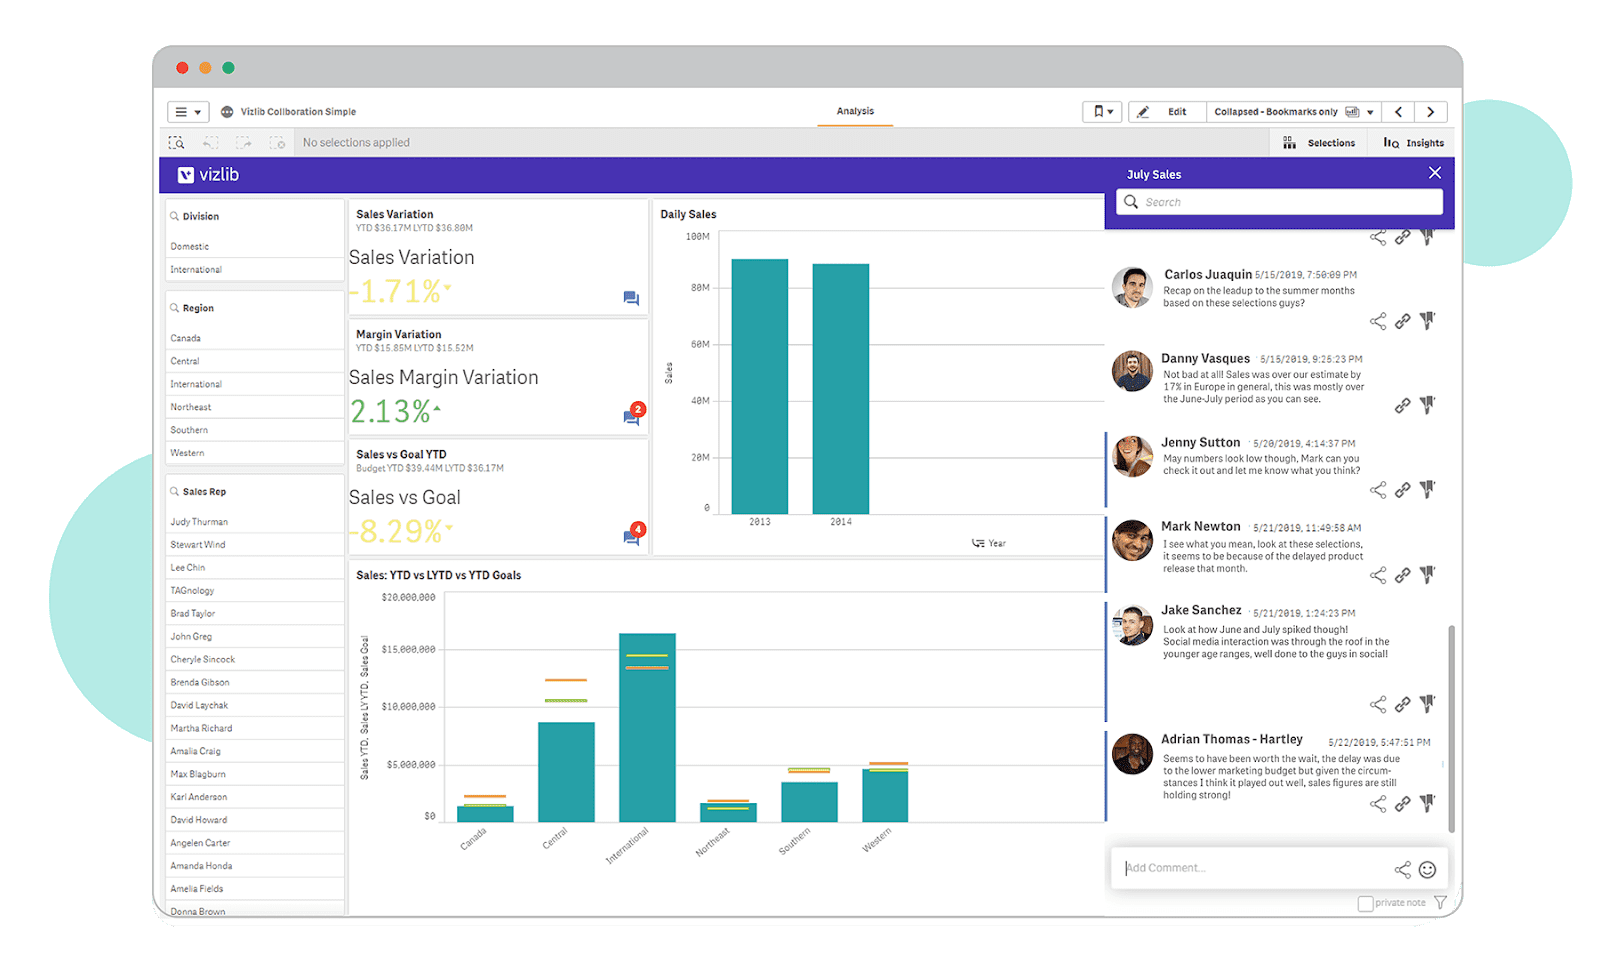
Robust analytics platforms provide users with numerous data visualization tools, such as multi-faceted dashboards that connect all the stored data from various sources, templates, interactive charts, drag-and-drop interfaces for easy document creation with graphical data, etc. Flexible data visualization helps analyze a company’s performance and extract the meaning from data.
- Increased customer loyalty
Better analysis of the customers’ interactions with the provided product means a more profound comprehension of their challenges, needs, and desires. The tools that may be obtained by building an analytics software allow businesses to dive deeper into the mind of the target audience, adjust and improve the provided services to its needs, and convert customers into loyal ones.
As you may see, an analytics platform’s advantages can significantly boost the company’s business capabilities and provide a comprehensive overview of its performance. However, the success of an analytics platform heavily depends on its functionality. Thus, proceed to the next section to determine the required feature set to make an analytics platform.
Top 7 must-have features for the analytics platform
The more thorough is the approach towards the choice of feature set for the analytics platform, the easier the potential users will achieve their goals. Hence, the first step on the path towards building an analytics software is an in-depth analysis of the target audience that will leverage the provided software. It’s desirable to think in terms of the following parameters:
- type and size of the organizations that will use your software;
- users needs regarding the set of analytics tools;
- approximate volume of data within the organizations;
- type of users (administrators, managers who will have full access to all analytics tools, or users who will view analytics occasionally, etc.);
- the necessity in collaboration tools, etc.
With a clear picture of your target audience requirements and needs, it’s time to proceed to the next step — analyze the competitors from the market segment you are about to enter. Such an approach will help you understand their weaknesses better, identify missing features, and consider them while developing your product.
Based on our expertise, we offer to look at the list of key features required to create an analytics platform. Mind that the set of web analytics tools of your platform may be extended and adjusted to the needs of your potential target audience.
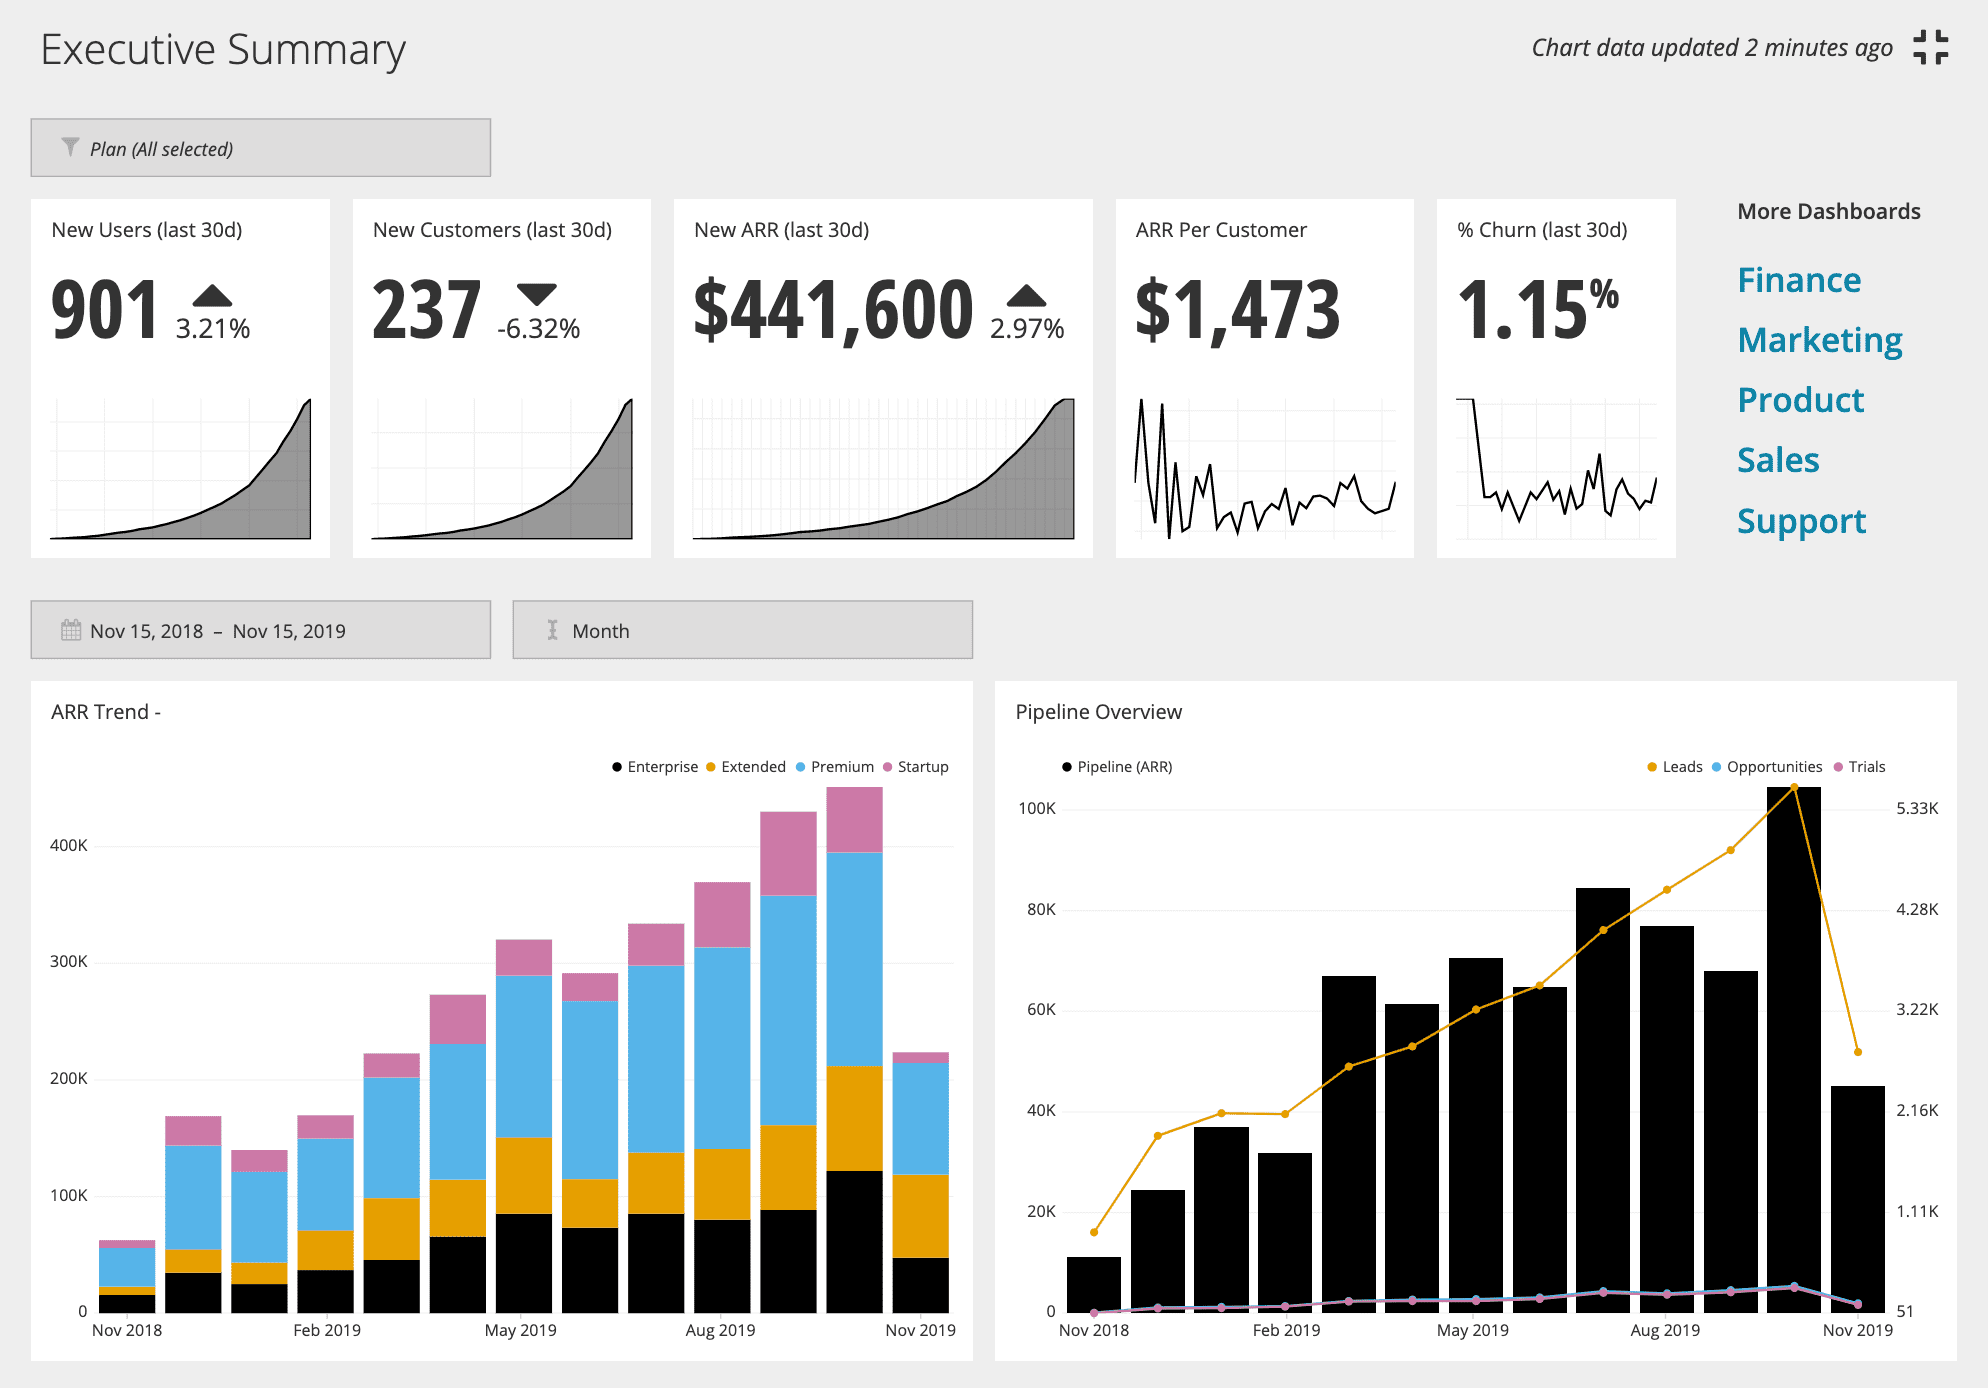
Advanced reporting
This is one of the major features that allows users to organize their data into informational summaries and helps businesses monitor how various areas within their company are performing. When building an analytics platform, ensure you create a sufficient amount of reporting tools such as tables, charts, barcodes, infographics, etc. that will assist your customers with report management. Moreover, ensure that the developed tools cover the whole spectrum of your users’ needs regarding the reporting, allowing them to perform report delivery scheduling, formatting, conversion, and customization.

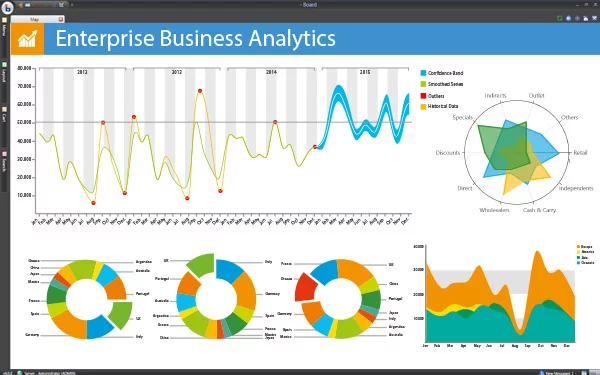
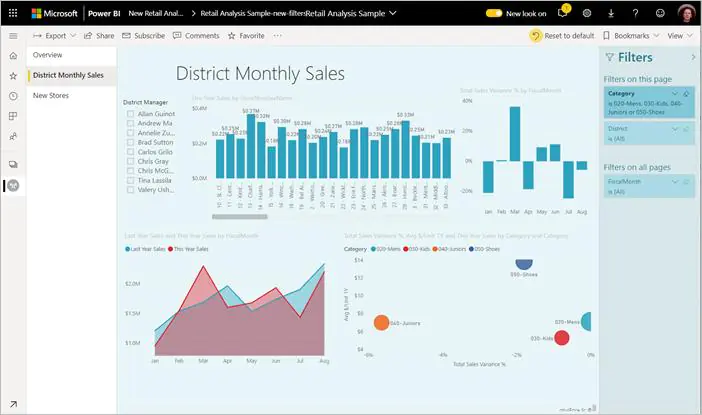
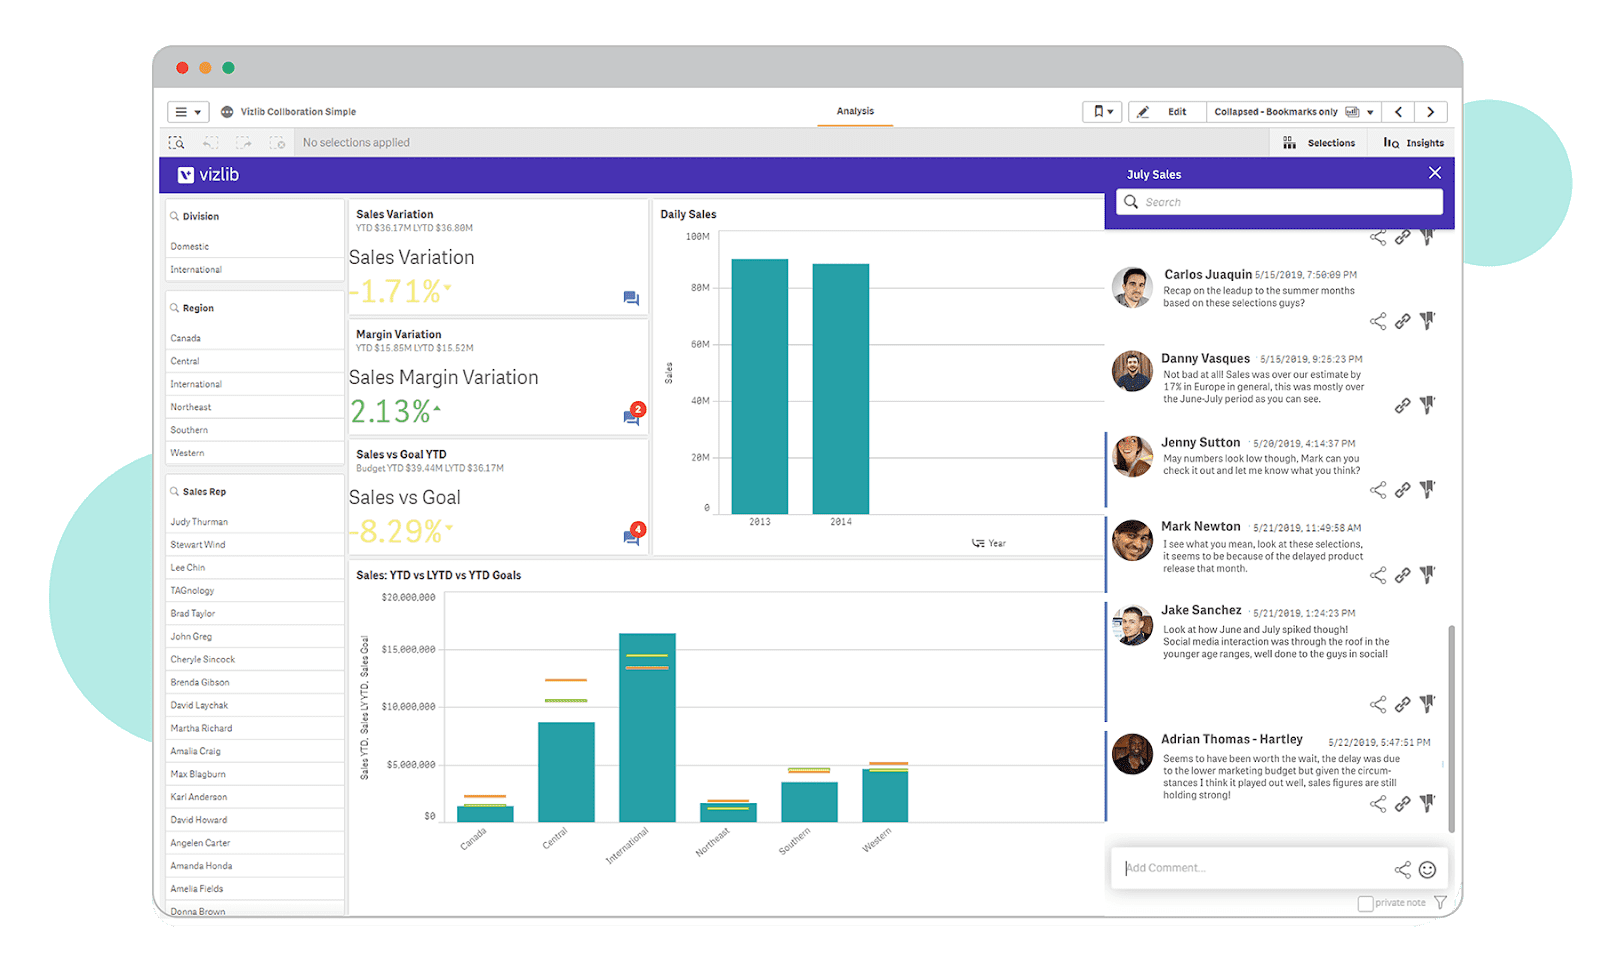
Robust data visualization
The very essence of an analytics platform is to allow its users to present data visually in a simplified and efficient way. Consider providing the customers with a wide range of graphical data representation tools, such as interactive dashboards, pattern indicators, diagrams, etc. Data visualization helps companies transform dull numerical data into a vivid representation of their performance, detect hidden patterns, and find a correlation between various data sets.
Data filtering & and sorting
Another useful feature is data filtering & sorting that can assist users with a convenient and accelerated way of data management. When you create a web analytics application, don’t forget to include advanced filters so that users can narrow their search and focus on the analysis of the particular sets of the company’s data. The sorting feature will allow users to arrange their datasets by particular values in a meaningful order for better comprehension and further analysis.

Data transformation
Tools for data transformation are vital to make an analytics platform thrive. They help extract data from the place where it’s stored, convert it into a required format, and transfer it to the target place where it will be ultimately analyzed. Since the organization may have multiple data sources (tables, flat files, etc.), the analytics platform should handle complex transformation procedures so that users can extract valuable business insights from properly processed and structured data.
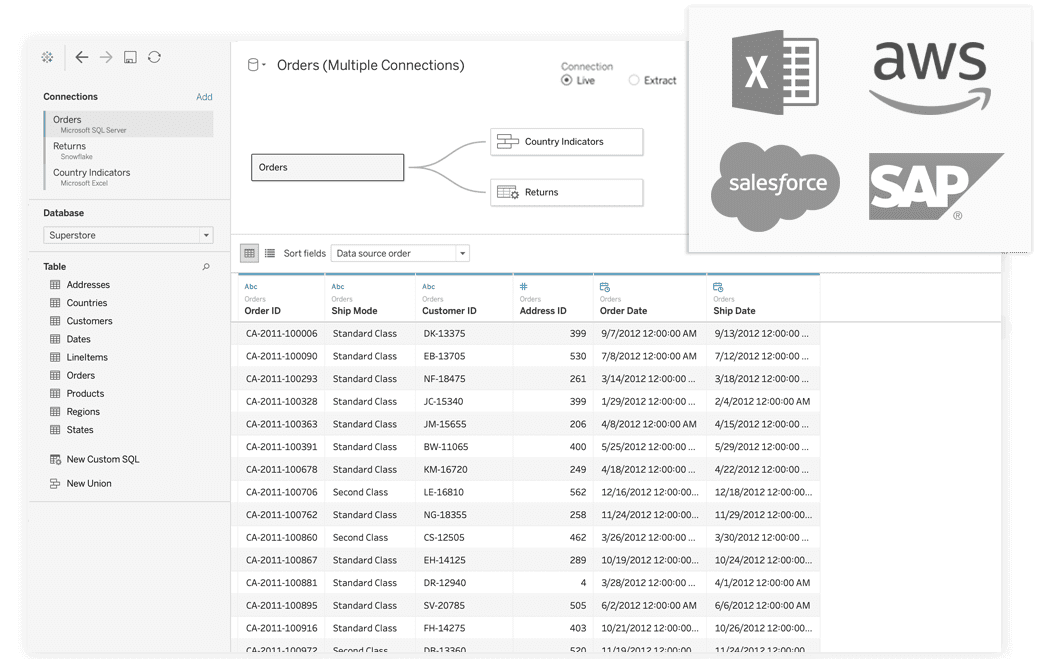
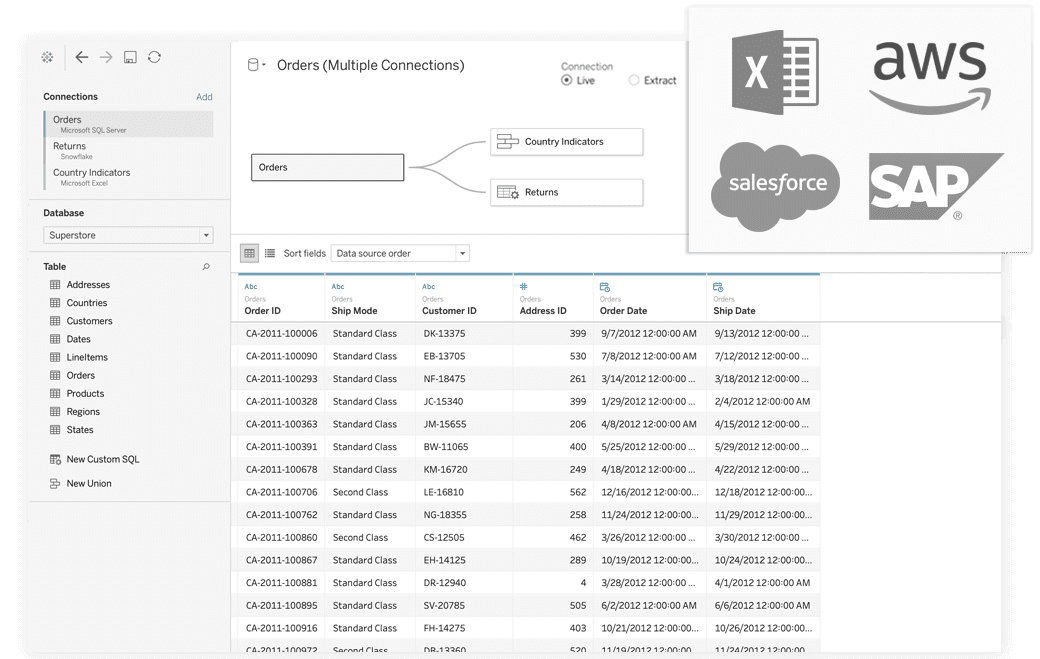
Data sources integration
When designing an analytics app, ensure your users have a convenient tool to pull their information from more than one data storage (CRMs, ERPs, spreadsheets, etc.). It will become possible by developing a unified data warehouse where unstructured and raw data will be securely stored from different sources that are incompatible with each other. Such a feature will ensure accelerated and simplified data extraction and further processing.
Controllable sharing
Since the information accumulated by different departments and teams is stored in various data sources, users should have an efficient toolset for collaborative data management and visualization. When designing an analytics app, ensure your interface contains efficient tools for data and report sharing, commenting, pinning, annotations adding, alerting, and other necessary tools for collective data analysis.
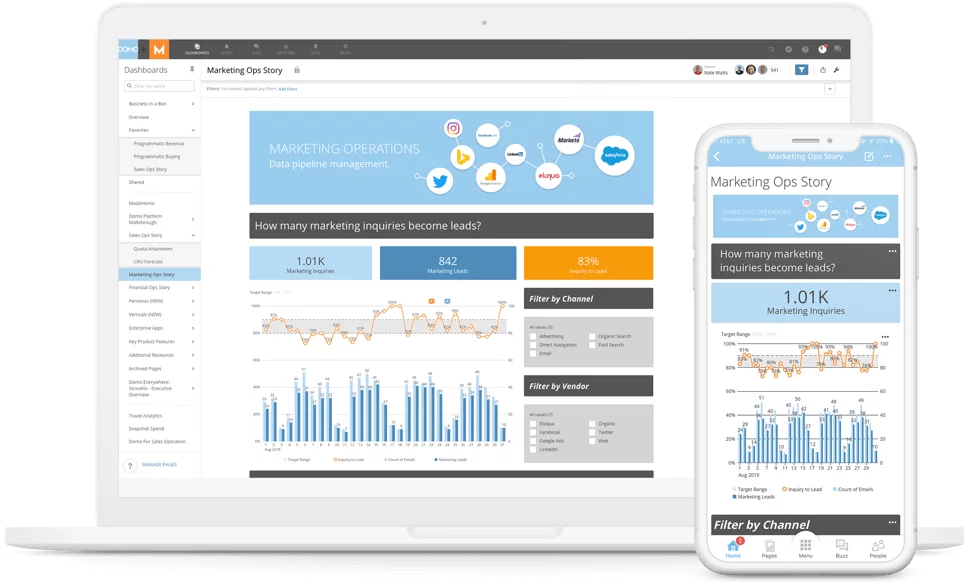
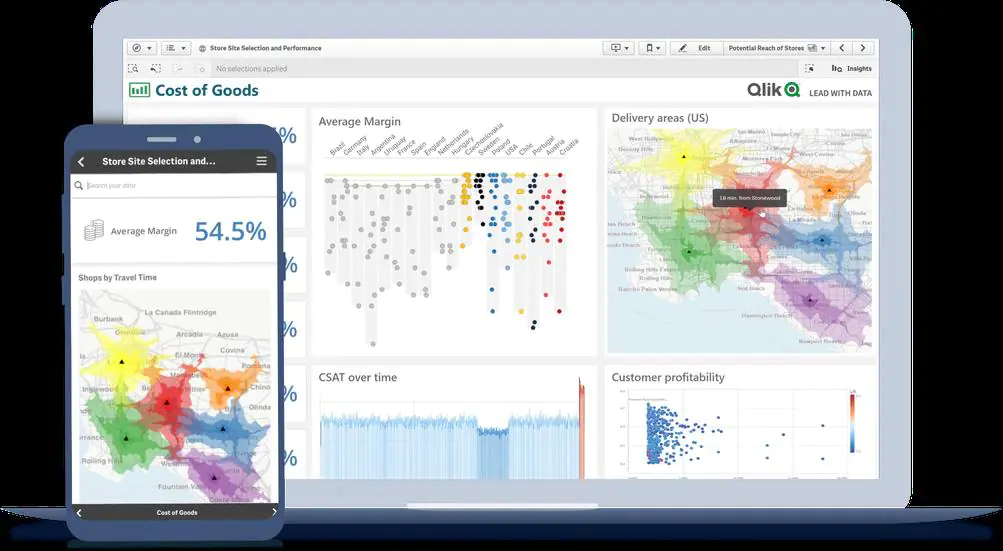
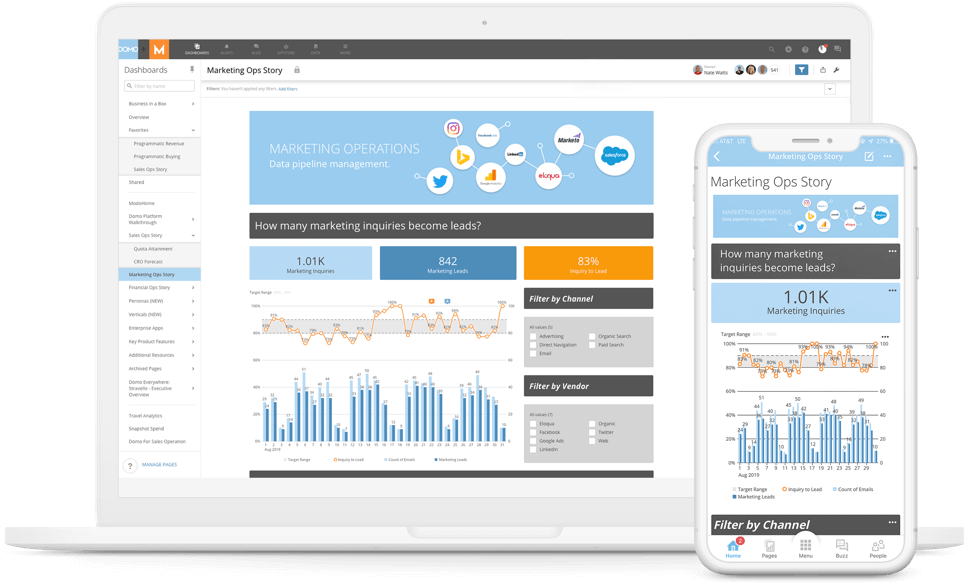
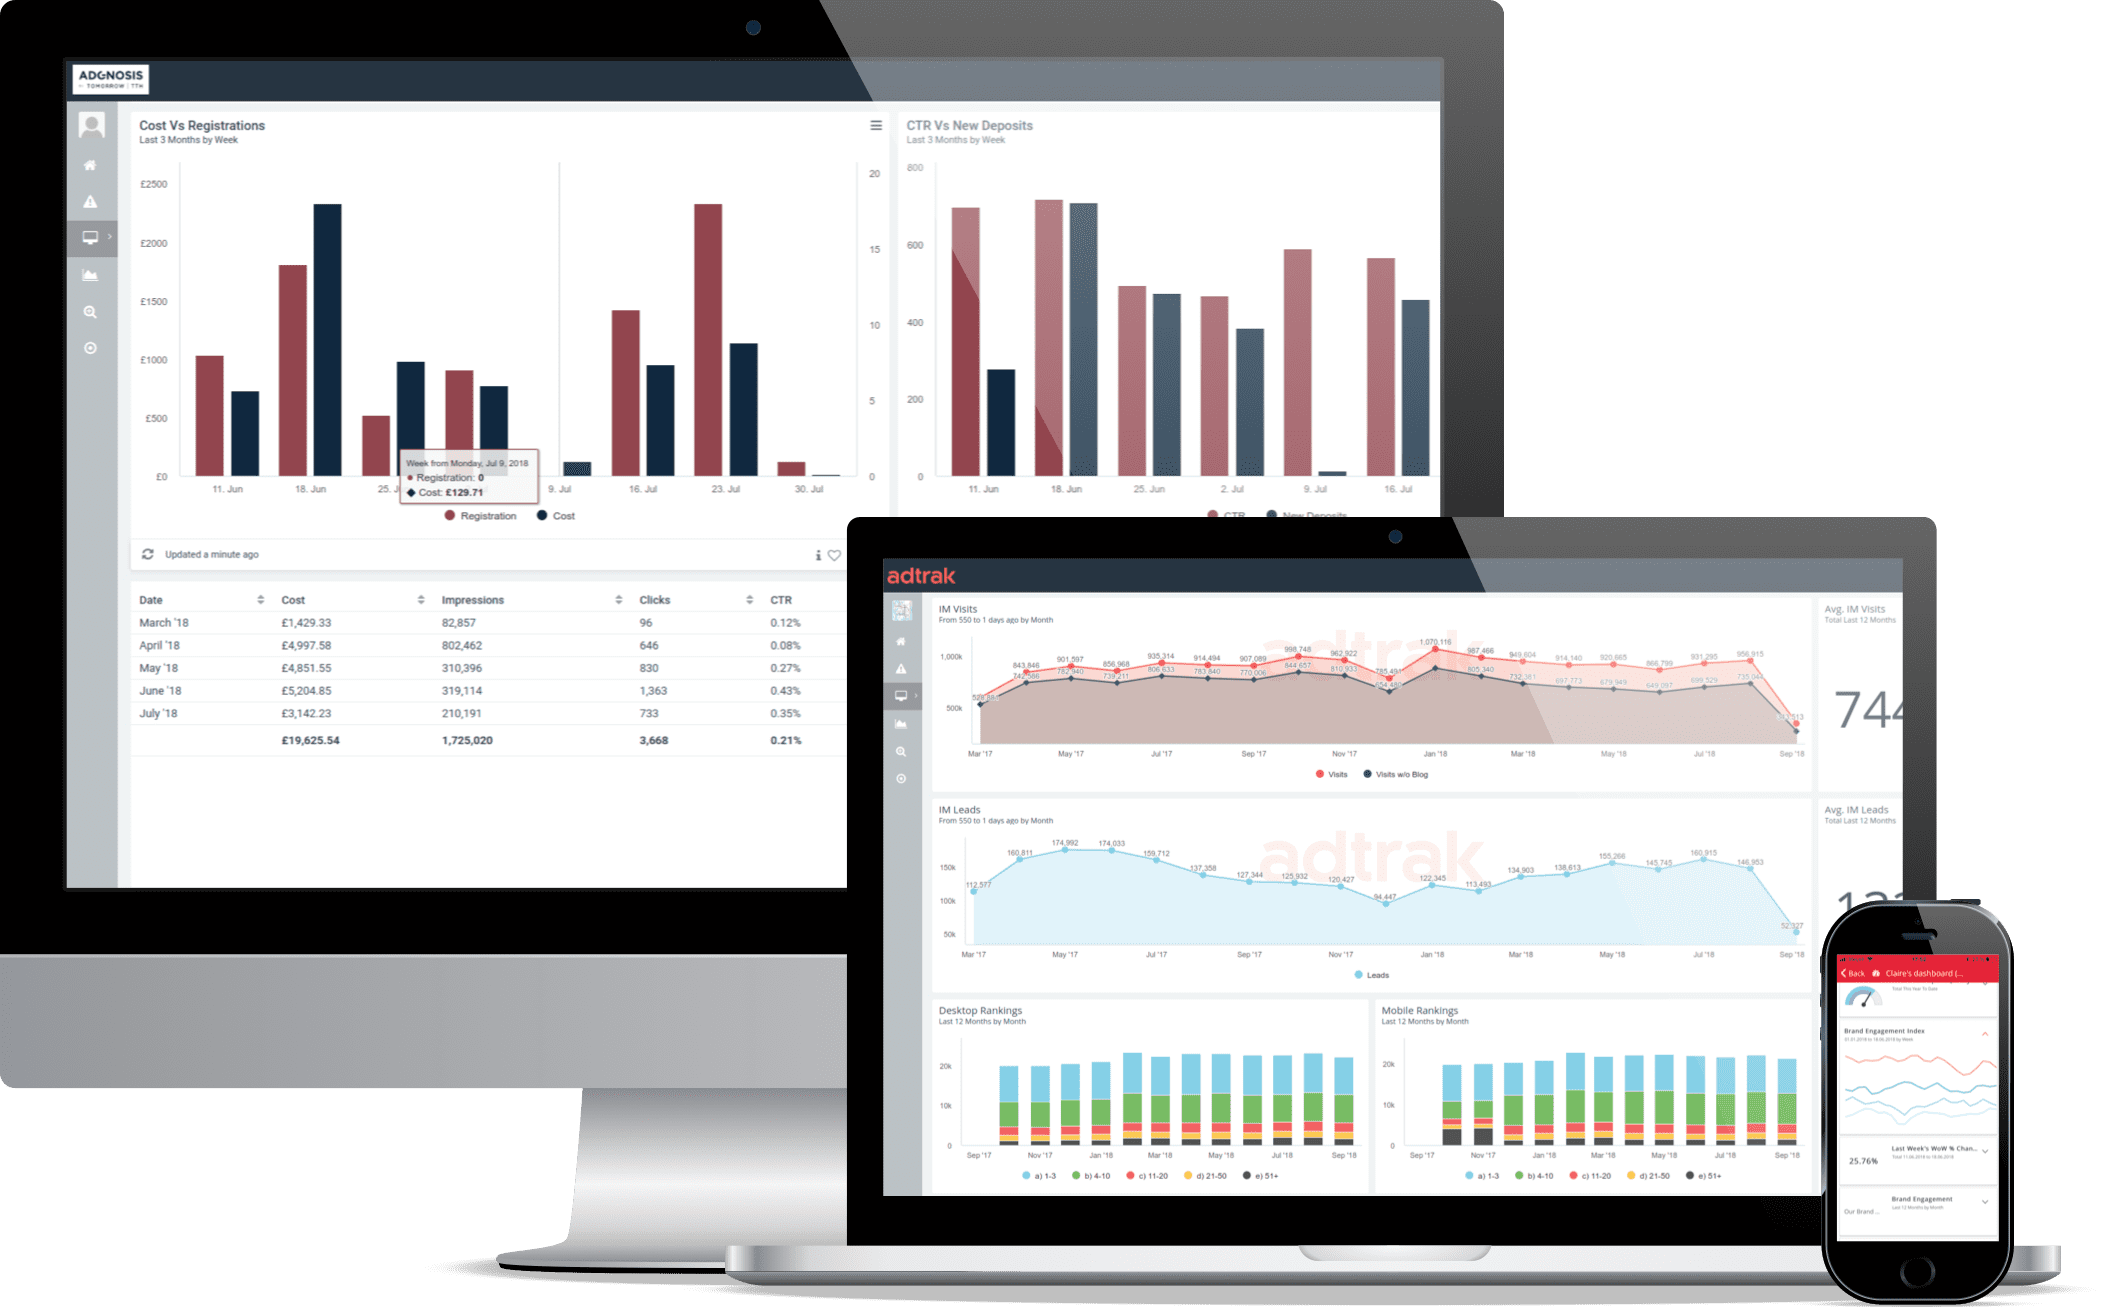
Web & mobile access
In the era of digitization, it’s required to ensure your users have web and mobile access to the provided services. Employees should be able to make data-driven choices in a convenient and accessible way without being forced to be attached solely to their desks. If you are not planning to have a mobile version of your analytics platform, consider making your web app mobile-friendly to gain more loyal customers.

Having examined the required functionality for this BI technology, let’s look at the necessary steps to build an analytics tool from scratch.
4 Steps to create your own analytics platform: tips to consider and mistakes to avoid
The analytics platform is a multi-faceted business intelligence tool that requires a thorough approach towards such a product creation. In this section, we will look more precisely at major data analytics software development stages.
Going through the business analysis stage
Business analysis (BA) is an integral part of any software development. Whether it’s a web or a mobile app, sophisticated DMS (document management system), or business intelligence software, BA should include a particular set of stages.
- Set the business objectives. At this starting point, it’s desirable to identify the main mission of your future product, figure out which user challenges your software will help solve, and define the overall concept. By doing this, you’ll have a unified vision of your product and set further goals more accurately.
- Examine your domain. This stage usually encompasses multiple areas, such as analyzing the market segment that you plan to enter, reviewing your competitors’ solutions, and determining their strengths and weaknesses. The defined strengths will help you with the creation of the list of the required features. In turn, their weak points will show what aspects will have to be improved in your future product.
- Determine functional and non-functional requirements. Firstly, this step will help you identify the exact feature set that you plan to develop. It should be based on the analysis of the potential users’ needs. Such requirements tell how the system will behave in different scenarios and what steps the users will do to achieve their goals. They may be presented in the form of user cases, user stories, diagrams, prototypes, and other formats. Secondly, the stage helps correctly determine the so-called quality attributes necessary to describe the software’s overall characteristics.
We mentioned the most vital parts of the BA. Mind that the additional stages of the BA may vary depending on the size and complexity of the project. The outcome of a successfully conducted BA may be rather fruitful and lead to significant cost savings. If none of the vital requirements is skipped, fewer iterations will be required to implement the missing features, and your spending will be lower.
Visualizing your concept via design
The design part for the analytics platform differs greatly from its creation for any other software. Since the ability to quickly analyze data and extract valuable business insights directly impacts their transformation into data-driven decisions, both UX and UI should be well-thought-out. We will examine a few tips that may help you make an analytics tool with thoughtful design.
Tips to consider when approaching UX
- Information Architecture is the priority. When you create an analytics platform, the whole design logic of such a type of software should be structured so that any user could easily understand how it works. Information Architecture (IA) encompasses a wide range of parameters that should be thoroughly designed: overall infrastructure and hierarchy, platform’s navigation, the arrangement of functionality, etc. The success of your analytics platform will highly depend on this design constituent since badly developed information architecture leads to poor user experience and, as a result, a high rate of customer churn.
- The easier, the better. The analytics platform is often used as a BI tool for quick data-driven decisions. Hence, it’s vital not to overwhelm the interface and its structural constituents with excessive functionality. For example, one of the data analytics components — generation of reports design is rather complex in terms of the number of tools and controllers it has. Thus, it’s highly important to approach its logic and view thoroughly so that it won’t take lots of time for potential users to learn how to use it.
Top 3 rules to create a better UI
- Opt for a minimalistic approach. UI simplicity and restraint are those key design principles that should be used while creating visual components and analytics platforms. The simpler is the interface of this business intelligence tool, the easier will be the users’ interaction with the platform.
- Be consistent in terms of a color scheme. It’s desirable to opt for a unified philosophy of color not to distract your users.
- Labeling is your magic pill. Proper iconography and button labeling is another aspect to consider while creating UI for your platform. Incorrect labeling on an important button, such as report link or data integration, may cause certain issues for users. It also may lead to the misunderstanding of certain features and tools in case it’s labeled inaccurately.
As you can see, the design stage covers various aspects that should be considered during its development. A properly designed UX and implemented UI multiply chances that your analytics platform will thrive. With all that in mind, let’s proceed to the next section that explores the actual development of an analytics platform and the most vital technical tips that will be helpful on this software journey.
Here comes the actual development
The choice of the approach towards analytical software design depends on numerous factors: the desired functionality, budget, business goals, etc.
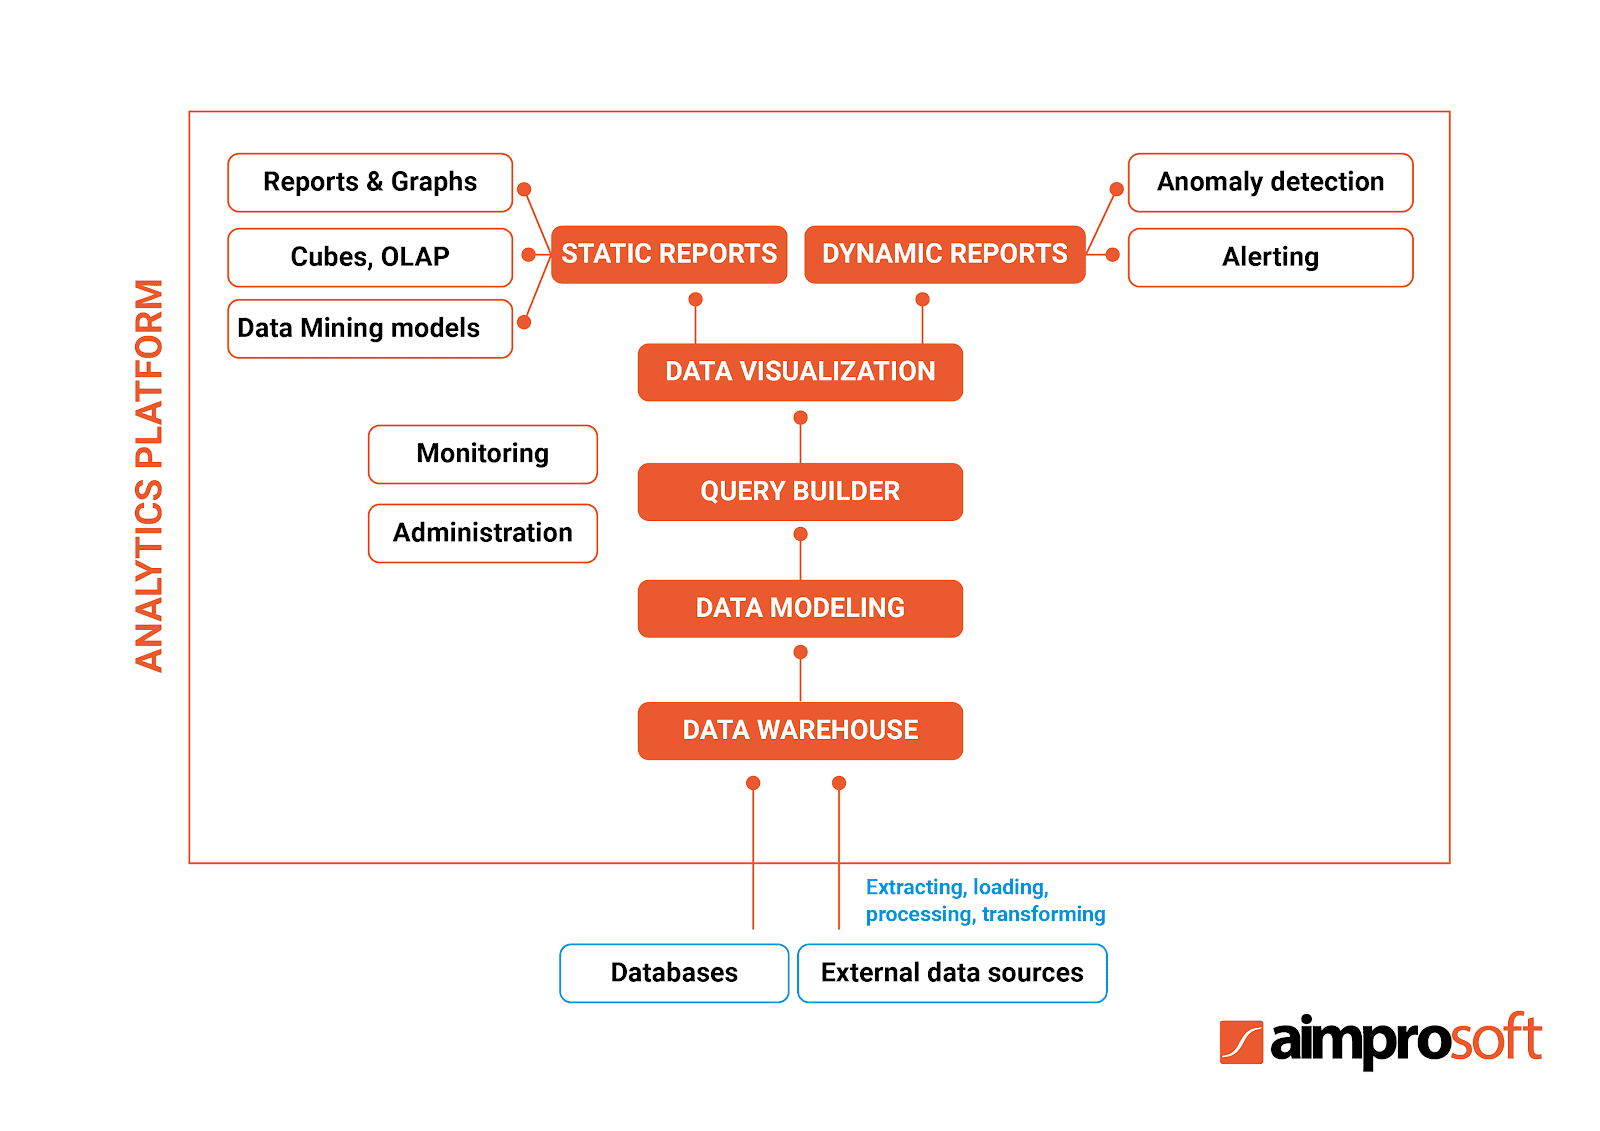
It’s necessary to opt for a correct strategy of a feature set implementation to achieve the seamless functioning of this multifaceted mechanism. We will examine three possible scenarios of building an analytics platform that may help you choose wisely. The picture below is a graphical representation of a standard analytics platform architecture that we will use to describe the development of its main components.

1. Using already existing software solutions
We consider this approach as one of the most time and cost-saving ones to make an analytics tool. The very essence of this option is to combine solutions that are already on the market and have proved their quality and efficiency. Thus, the ultimate goal is to connect all disparate software tools so that everything works as a unified mechanism.
Such an approach towards development should be leveraged when you are about to create an MVP version of your product. This will help identify whether you are satisfied with the solutions you are already using, or it’s required to develop one from scratch. Moreover, this strategy may help test the viability of your idea, identify all weaknesses without great expenses. Thus, by using the scheme above for a better analysis of all analytics platform components and their interaction, let’s look at how to build an analytics software.
Data transformation
As it was already mentioned before, the organization may have various disparate external data sources (ERP, CRM, flat files, etc.) containing data of different standards and formats. The extracted data should be prepared for further analytics, namely converted and sent to a centralized data warehouse. The ETL (extract, transform, load) process is a popular and efficient solution that can be used for such purposes.To create an analytics platform MVP, you may opt for one of the proven and reliable ETL platform providers on the market, hence, not only obtaining an efficient tool for data transformation but also saving time on its development.
Popular examples: Apache Airflow, Xplenty, AWS Glue, Stitch.
Learn more about the ways to build your own ETL processData warehouse
Once the data goes through the ETL process and completes the transformation stage, it is loaded to the data warehouse for further analysis. We advise designing the entire architecture of your data warehouse in advance since its structure may impact numerous aspects of the data analytics process. Each type of data warehouse architecture (single, two, or three-tier) functions differently. Thus, identify your requirements towards the architecture first to choose the most suitable option. Also, make sure that the chosen data warehouse is voluminous and fast to obtain high data quality, consistency, and accuracy. Popular examples: Hadoop, AWS S3, AWS Redshift.Data modeling
This analytics platform constituent is responsible for the correct storage of the requests configured by the users, proper data processing, and preparation for further visualization. It’s required since the analytics platform needs storage for operational data that may include requests and reports created by the query builder, metadata of everything that is stored in the warehouse, etc. Thus, before building a certain chart or diagram, a data modeling component will extract data from the data warehouse and prepare it for further mapping. This architectural component will have to be developed from scratch due to the absence of a corresponding market solution.Monitoring & Administration
The data monitoring ensures that all the components of the data analytics platform are functioning properly. For example, if there is an ETL process, monitoring should enable users to check the quality of its performance. Such a tool will also ensure proper control of data warehouse condition, the status of components that are responsible for reports generation, etc. Popular examples: Amazon CloudWatch, Site24x7.Query builder
If you look at the scheme of the analytics platform above, you will see a link connecting the data warehouse and data modeling component. This constituent helps data administrators and managers easily create analytics queries. This part will have to be developed from scratch to adjust the interface and its functionality to the particular requirements since there are no ready-made solutions on the market.Data visualization
There are numerous ways to approach a data visualization procedure. The tools for accurate data visualization should be chosen depending on either dynamic (anomaly detection, alerts, real-time data changes) or static reporting (periodically generated reports or upon request). Thus, data visualization methods will vary as well, whether you want the data to be visualized via graphs, rich reports, dashboards, or any other option that will suit the end-users’ needs.We also advise considering a few more factors while choosing a data visualization software best suited for your needs: type of audience, context, degree of data dynamics, and purpose.Popular examples: JasperReports, Sisense, Grafana.
2. Development from scratch
If you decide to build an analytics tool from scratch, mind that this approach is the most time, money, and effort consuming among all three strategies. We advise opting for it only if the MVP developed from scratch satisfies your business and functional requirements, and you are ready to transform it into a full-fledged product. The approximate time required to build a full-fledged competitive product highly depends on the feature set, varying from 1 to several years of development. The more complicated the functionality that has to be implemented from the ground up, the longer it will take to complete the entire development process.
3. Merging the first two approaches
The last approach may be considered as a symbiosis of the first two strategies. Such a way of analytical software design is appropriate if you have already started developing the MVP version of your analytics platform and found out that a certain software solution doesn’t meet your requirements. For example, you opted for JasperReport and realized in the course of its usage that this reporting engine doesn’t quite meet your requirement towards data visualization. In this case, you will have to develop the necessary data visualization solution from scratch.
4. Don’t neglect QA and testing
Better product quality, reduction of bugs and errors, the ability to determine the platform’s weaknesses become possible only via well-defined QA strategy, and thoroughly performed testing. It’s desirable to integrate Quality Assurance from the beginning of the product development to lower the number of iterations necessary for eliminating the emerged bugs.
Based on our experience, it’s necessary to conduct focus group testing during product development. Normally, it is performed in the early development stages to gather the overall impression of the product, users’ thoughts of it, determine flaws in the design, etc. You also need to apply alpha and beta testing: it is performed with different testing groups and helps identify functionality-related bugs before the actual product release. Among the great diversity of testing approaches, we advise opting for an efficient mixture of functional (sanity, regression, etc.) and non-functional testing options (security, performance, etc.). A well-designed testing strategy and artifacts will significantly improve the quality of the product.
Find out more about our approach to Quality AssuranceCost to develop analytics software
With an overview of all development stages and technical tips in mind, it’s time to finally proceed to the estimation of the time and cost required for data analytics software development. Time and cost normally depend on the chosen functionality, its complexity, and version of the product (MVP or a full-fledged one). We will examine an MVP version and required team stack for its creation so that you’ll have a more precise picture of analytics platform development.
The feature set for MVP should encompass the most important tools that would satisfy users’ basic needs. We advise not to overwhelm the functionality with sophisticated features, such as machine learning algorithms or tools for predictive analytics, and focus on a particular problem of your target audience. It will help you create this solution in a simplified and cost-saving way while covering essential users’ requirements. So we suggest including the following features into your future MVP:
- user registration/user authentication;
- user profile;
- reporting;
- data integration;
- data sorting & filtering;
- data visualization;
- data transformation.
The number of team members may vary depending on the chosen functionality, budget, and deadline. It may also vary in case you choose either a full-cycle development company like Aimprosoft that would accompany you throughout every step on this software journey or a software vendor that provides specific services. We will examine the first scenario in which the whole team is from one software vendor that can develop custom analytics applications of any complexity. The implementation of all the features mentioned above will require such a team stack:
- 1 Tech Lead/Architect;
- 1 Business Analyst;
- 1 Project Manager;
- 1+ Full Stack developer(s);
- 1+ QA engineer(s).
Based on the functionality of an MVP version, we have calculated the approximate time necessary for data analytics application development.
| Stages | MVP hours ~560—900 |
|---|---|
| Business Analysis + Requirements gatherings | 80—120 |
| Technical specification | 40—60 |
| Frontend+Backend development | 300—500 |
| Product architecture | 40—60 |
| QA + testing | 100—160 |
The estimated time in the table above depends on the desired feature stack, deadline, number of team members, etc. We based our estimation on one of the most time-saving approaches towards the MVP development of the analytics platform: the one that presupposes the combination of already existing software solutions.
A Business Analysis stage to create a web analytics application will take approximately 80—120 hours. On QA and Testing, you’ll have to spend approximately 25-30% of all development stages. In the case of the analytics platform, it may take about 100—160 hours to test the implemented functionality.
We didn’t include the estimation of the full-fledged product since the number of factors that impact the time required for its full version development is significantly higher than MVP. Moreover, the functionality may drastically vary in each particular case.
The table below provides approximate cost estimation based on the data from the previous table. Also, we calculated the cost to develop an analytics software, considering the price range of software vendors from different geographical areas for a more precise analysis.
| Country | Average hourly rate | MVP ~560—900 hours |
|---|---|---|
| USA | $80 | $44 800—72 000 |
| Western Europe (Germany) | $65 | $36 400—58 500 |
| UK | $70 | $39 200—63 000 |
| Eastern Europe (Ukraine) | $30 | $16 800—27 000 |
As you may see, software development services may significantly differ depending on the country. For example, the development of an analytics platform MVP with a minimum feature set may cost you approximately $44 800 if you choose among software vendors that develop custom analytics applications from the USA. Whereas, the services of the IT vendor from Eastern Europe may be significantly lower, about $16 800. In turn, if you decide to develop your MVP with more extended functionality, the cost to develop an analytics software will be about $63 000 if you choose the IT company from the UK. You will be able to spend half the cost if you turn to the services of the Ukrainian software development company.
Mind that there is no particular correlation between the geographical location and the quality of the development. Thus, “the higher the cost, the better the quality of the provided services” pattern isn’t always quite accurate.
Our experience in building a data analytics platform
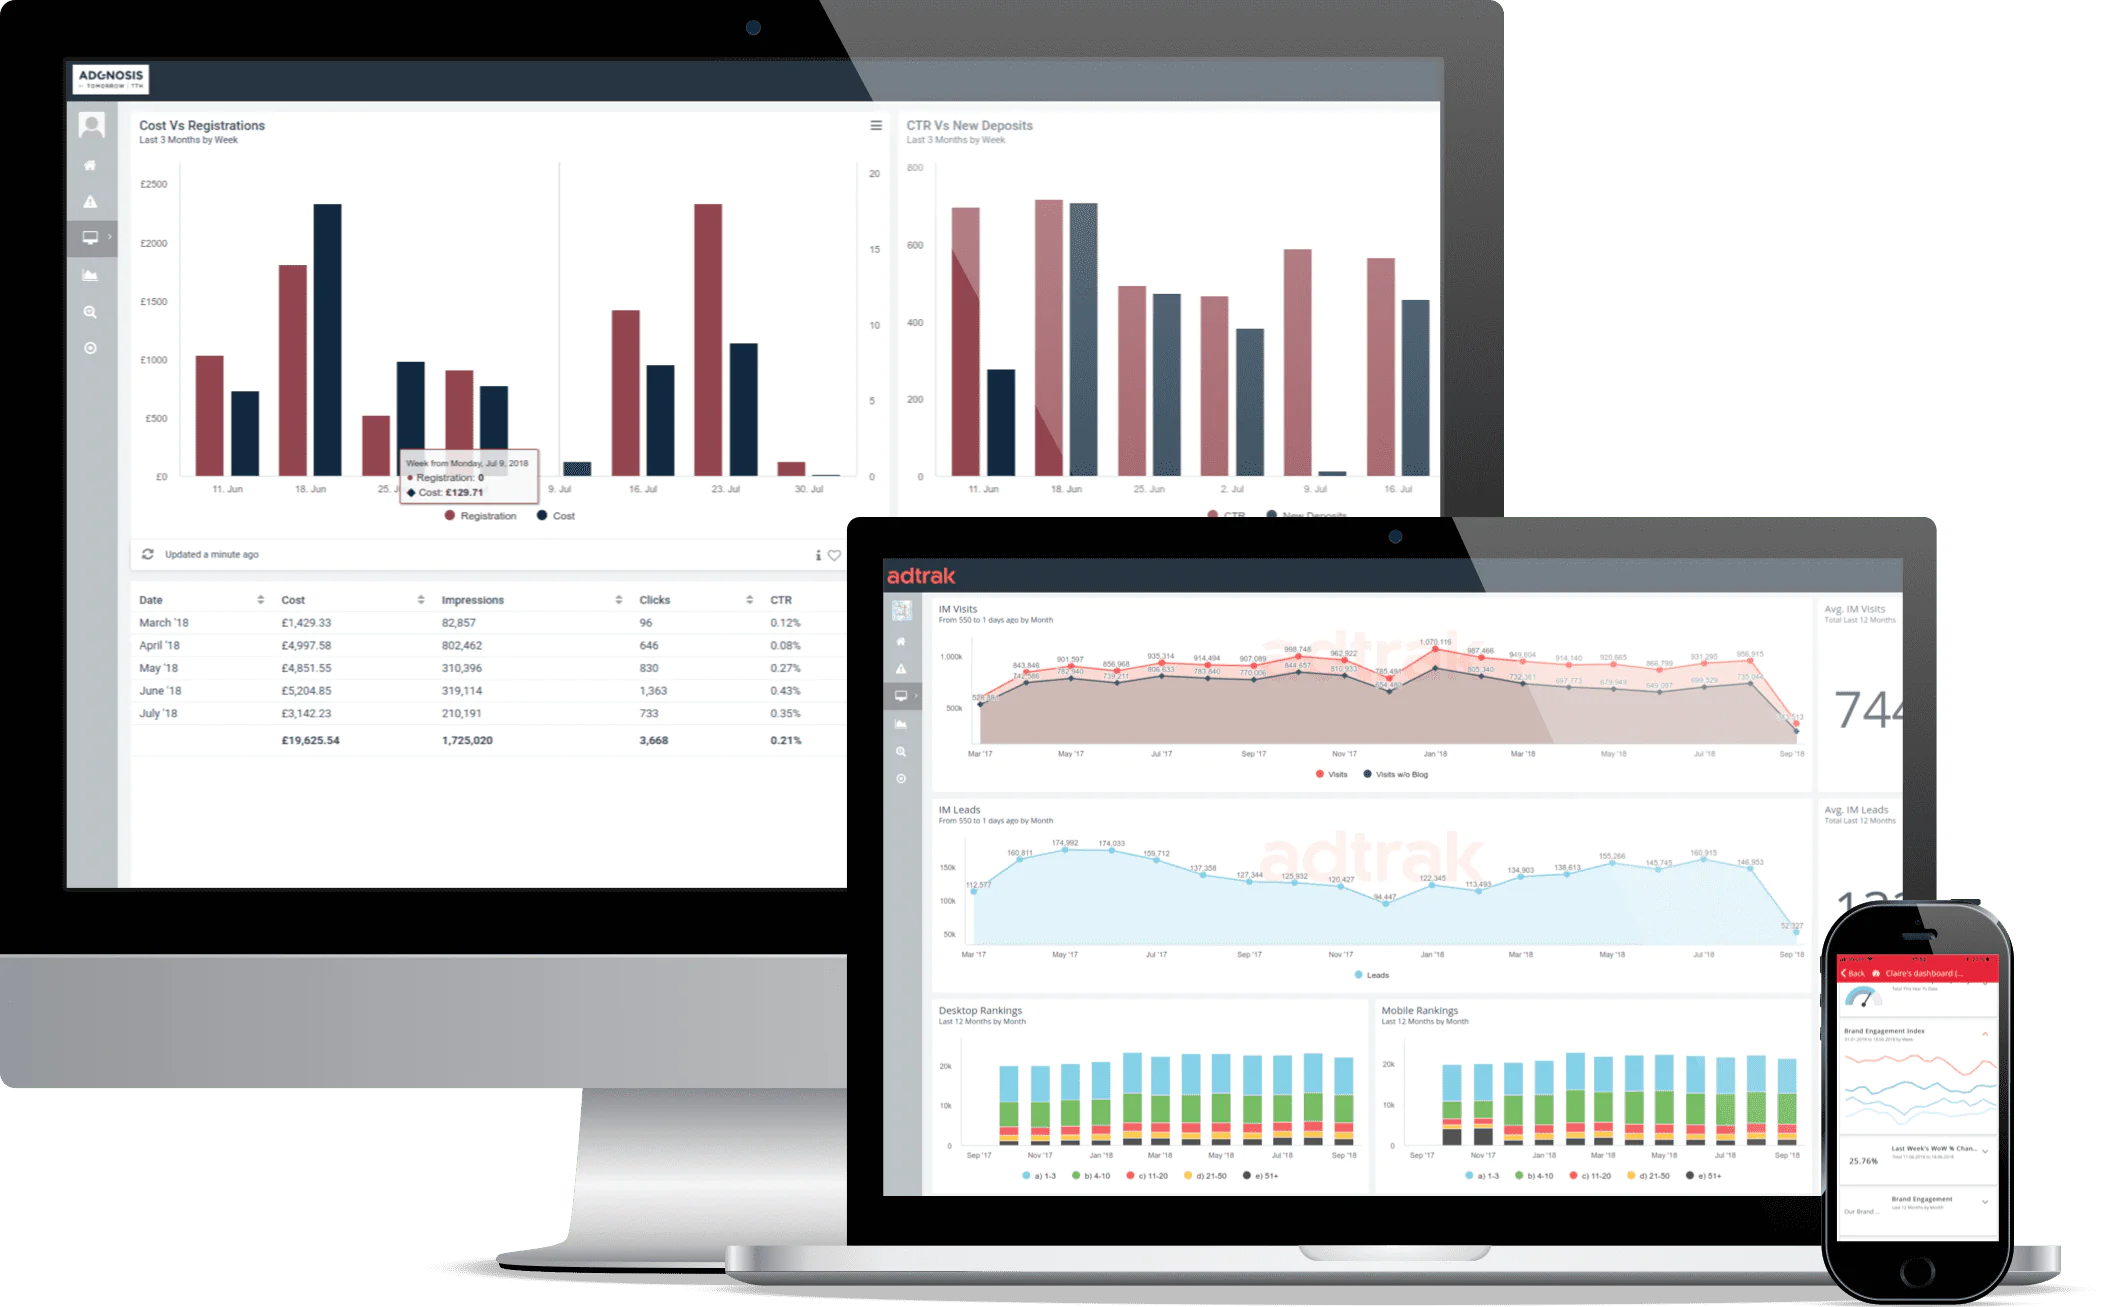
We managed to fully explore all the pitfalls and nuances related to the development of this BI tool when our customer came to us with the request to create Avora, an enterprise analytics platform. The customer needed to develop a robust business performance platform that would encompass all vital features for a robust analytics solution. The platform’s main mission was to provide users with a powerful toolset for in-depth real-time analytics of their data.
Our main goal was to implement core functionality for web and mobile versions of this analytics platform. To create a robust web analytics tool, our team opted for the capabilities of the Grails framework. For the successful development of the frontend part, it was decided to leverage the advantages of the Angular framework and webpack module bundler. In turn, the backend constituent was implemented with the help of MongoDB, MySQL, Amazon Redshift that was later substituted with Exasol, a convenient analytics database, Spring Framework, and a number of supplementary software.
The scope of developed functionality encompasses the ability to integrate all data sources across the enterprise, root cause analysis that helps users identify the reasons for shifts in the company’s performance, and real-time predictive analysis for a convenient extraction. Our team also implemented smart alerting that ensures the system (both web and mobile version) instantly notifies users in case certain changes in data occurred. It enabled all users with more accurate real-time performance monitoring and improved data-driven decisions from these meaningful notifications.
To provide efficient data visualization, the developers opted for C3.js, D3.js, HighCharts JS libraries. In addition to the mentioned functionality, our software engineers also implemented an anomaly detection feature that shows any data deviation from the norm or a sign of a strange pattern (unusual data points or data groups, changes, etc.)

Overall, lots of effort put by Aimprosoft developers and the strong desire of our customer to create a robust competitive product merged and, as a result, facilitated the launch of Avora. This multifaceted data analytics platform can now satisfy even the most sophisticated data-related users’ needs and offer a vast arsenal of tools necessary to monitor the company’s performance and extract valuable business insights.
Conclusion
Hopefully, this article helped with some challenging questions on how to build an analytics software. If you feel that the gathered insights are not enough, and want to learn more about this powerful BI tool, contact us, and our software specialists will assist you with the request of any complexity.
Frequently Asked Questions
Why do I need a data warehouse?
Secondly, if we consider an e-commerce website, a direct connection of external data sources with the store’s database may lead to its overload. Finally, other types of databases may be designed according to the database normalization design scheme, which means the queries for data extraction may be too complicated and slow. In turn, the data warehouse reduces the time required to find and analyze the necessary data.