How to Evaluate Business Processes for Automation: A Step-by-Step Guide
Published: – Updated:
To automate or not to automate — that is the question. Many businesses choose “not to” and stick to manual processes. According to the 2023 State of Finance Automation: SMB Financial Management Insights & Trends, manual work still occupies 25% to nearly 40% of employee and leadership time across most SMBs. But why? Why not automate repetitive tasks that are clearly robbing organizations of both productivity and revenue?
Over the years of working with business leaders, we’ve seen the same key reasons come up again and again for resisting automation.
- Comfort with the familiar. Many teams rely on spreadsheets and manual data entry. These methods feel safe and rarely produce major errors.
- Uncertainty about what to automate. Leaders hesitate because automation often requires retraining staff, restructuring workflows, and securing team buy-in alongside upfront capital investment.
- Automating the wrong processes. Some organizations jump into automation by tackling the most visible tasks, only to discover later that those efforts don’t move the needle. As a result, they waste resources and develop a lingering reluctance to try again.
What all these challenges have in common is information overload — lots of promises from vendors but no actual strategic guidance on how and where to start.
With this article, we aim to change that. Whether you’re a COO looking to streamline operations or a Digital Transformation Leader shaping your automation strategy, you’ll learn how to identify automation opportunities quickly and make confident, data-driven decisions about the automation of business processes.
This guide works equally well whether you’re exploring workflow automation for small business scenarios or building a long-term automation strategy for businesses.
Why process mapping comes before automation
The first step in business process automation isn’t automation itself. You read that right.
To automate processes and workflows effectively, companies need to know them first. That’s where business process mapping for automation comes in. We’re talking not just about documentation or onboarding tutorials, but clear visualization of each step of a workflow — who’s involved, what tools are used, and where handoffs happen. With that clarity, leaders can decide what processes should be automated and when to automate business processes.
Done right, process mapping creates shared understanding across teams, exposes bottlenecks, and prevents costly rework once automation is introduced. Equally important, involving teams in mapping builds early buy-in for workflow changes, since people are more likely to embrace automation they helped design. In other words, it turns automation from guesswork into a data-driven strategy. Without this foundation, even the most advanced business process automation services or intelligent business automation tools are unlikely to deliver full value.
Below, we’ve gathered approaches for process mapping that will help you in this task.
BPMN for process mapping
One of the most widely used ways to map workflows is BPMN (Business Process Model and Notation). BPMN is an international standard for documenting business processes that uses a common set of symbols and rules to represent how workflows actually function.
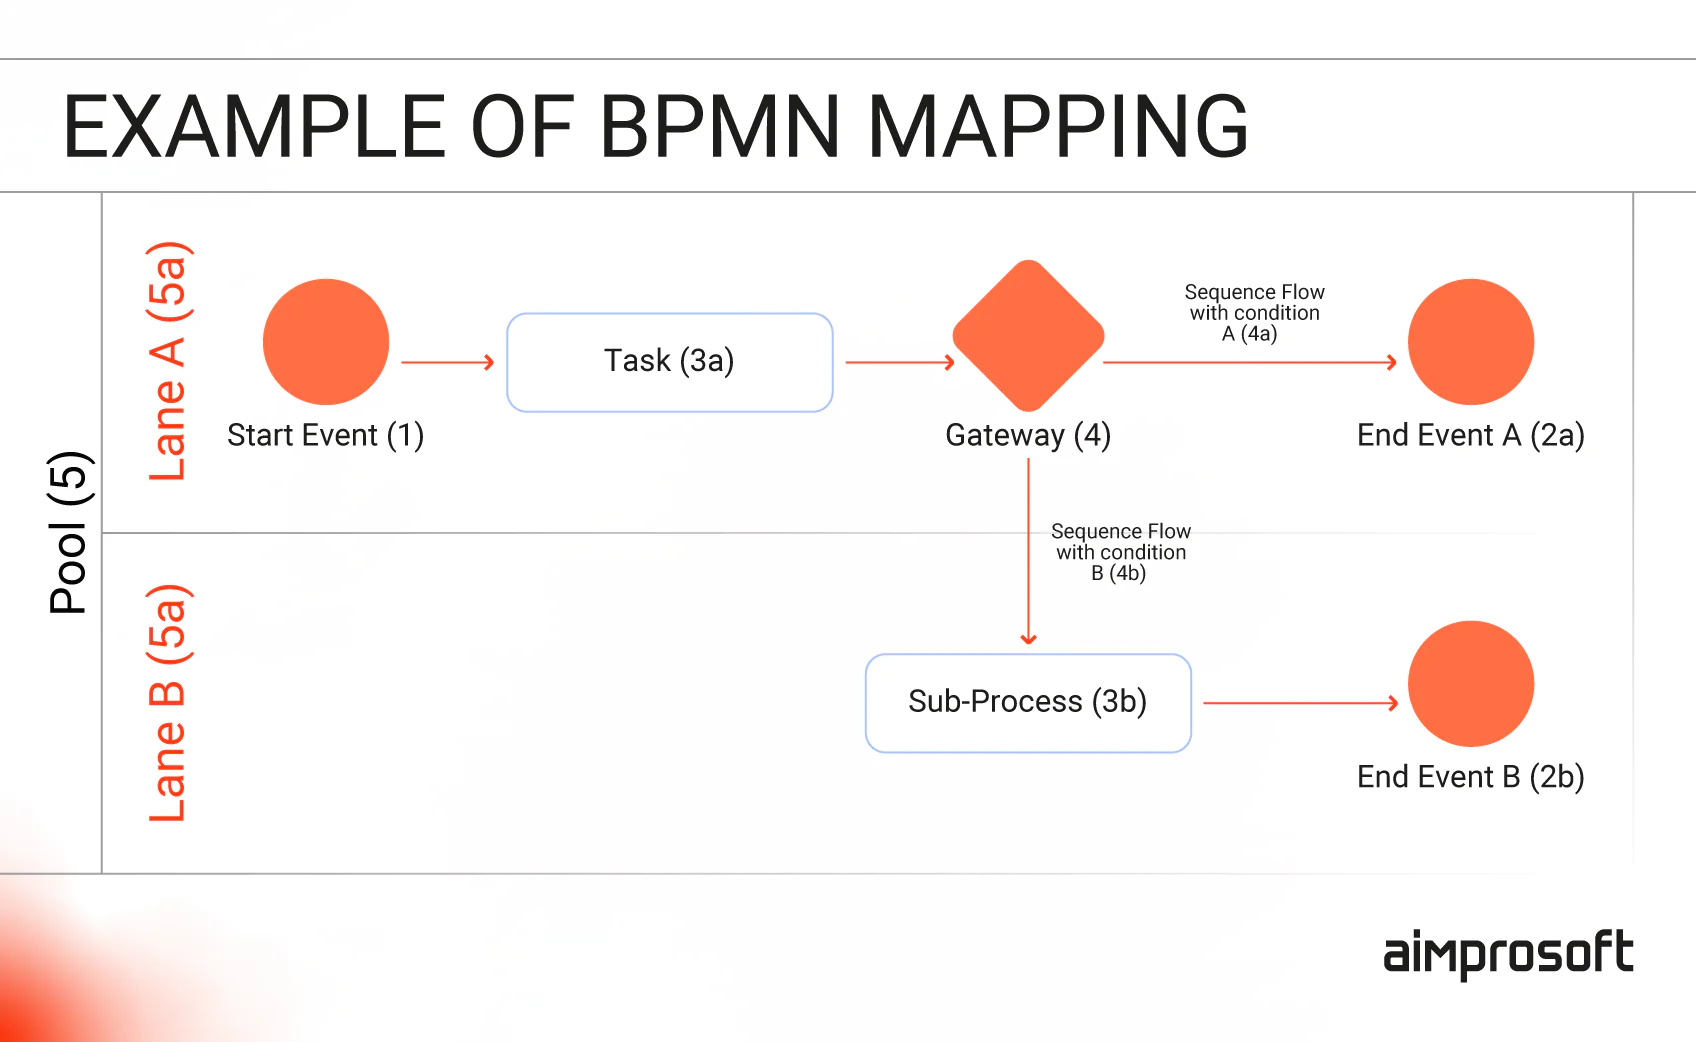
At its simplest, BPMN diagrams show:
- Entry points (where a process starts).
- Events inside the flow (such as approvals, notifications, or database updates).
- Decision branches (for example, “yes/no” outcomes that send the process in different directions).
- Exit points (how and where the process concludes).
Because BPMN follows a standard, any stakeholder who reads the diagram can understand what’s happening at each step — regardless of department or technical background. This makes it far more effective than a text document or onboarding manual, where details get lost and dependencies are hard to trace. BPMN illustrates why mapping isn’t just bureaucracy — it’s a practical automation assessment framework and part of any effective business process automation guide.
With it, leaders and teams can align on the same view of how a workflow operates, and that shared view becomes the baseline for building effective custom-built automation processes later.
Swimlane diagrams for cross-departmental clarity
While BPMN excels at documenting workflows, swimlane diagrams shine when you need to understand who does what across different departments. Think of swimlanes as organizing your process map into horizontal “lanes” — one for each department, role, or system involved.
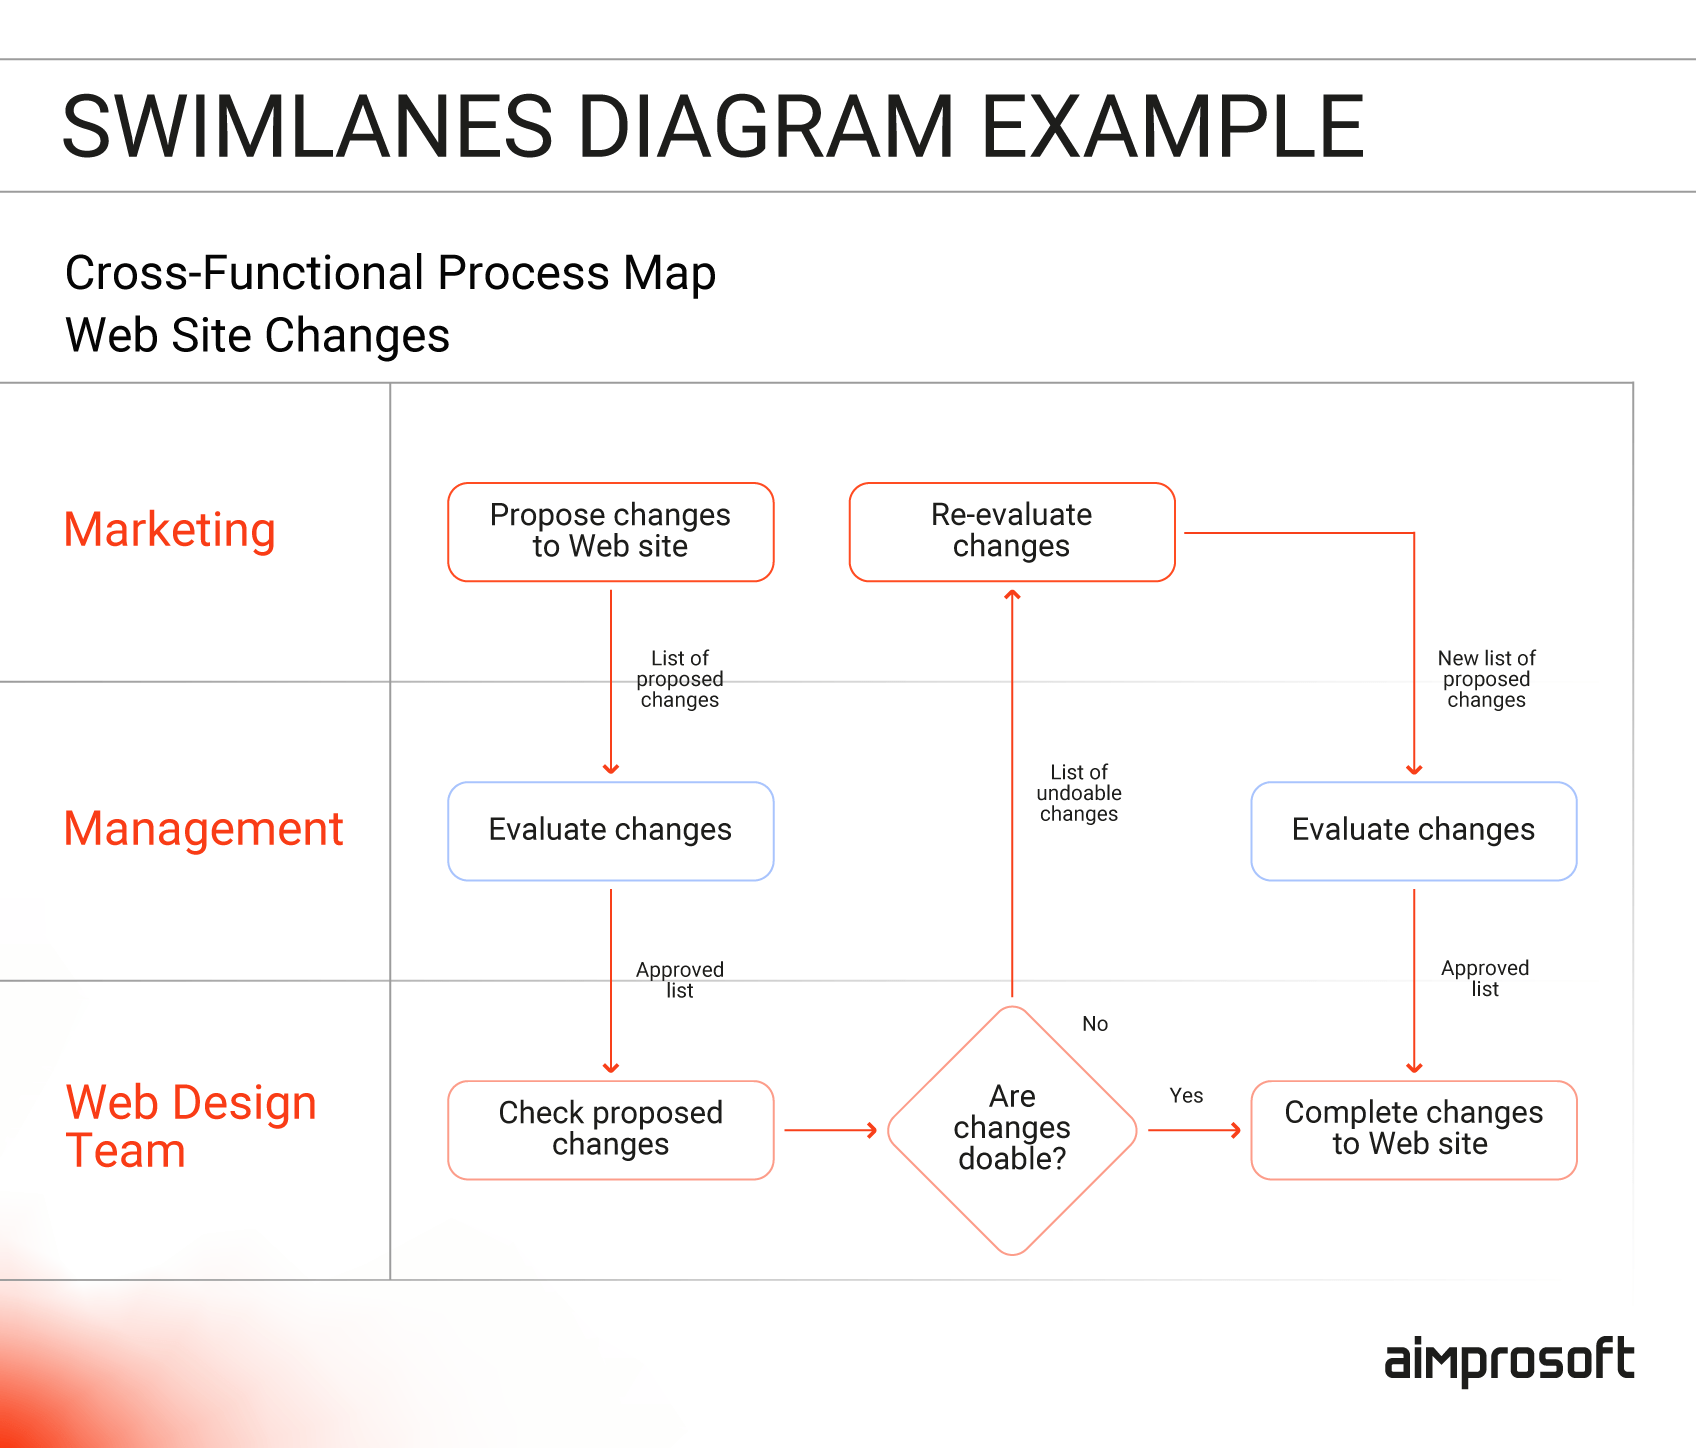
Here’s what makes swimlanes particularly valuable for selecting processes for automation:
- Clear accountability – Each step is assigned to a specific person or department.
- Handoff visibility – You can immediately see where work passes between teams.
- Bottleneck identification – Delays often happen at lane boundaries where coordination breaks down.
- Automation targeting – Tasks within a single lane are often easier to automate than cross-departmental handoffs.
For example, mapping a customer onboarding process might reveal that Sales, Legal, Finance, and IT each handle different steps — with an average 2-day delay each time the process moves between departments. This insight helps leaders focus on workflow automation prioritization: automate within departments first, then tackle the handoff coordination.
Swimlane diagrams make it easier to apply business process evaluation criteria because they clearly show which parts of a process involve multiple stakeholders versus single-department activities. This visibility is crucial for small business process automation where cross-training and clear handoffs often matter more than complex technology.
Value stream mapping for operational excellence
For manufacturing, logistics, and operations-heavy businesses, Value Stream Mapping (VSM) takes process documentation a step further by tracking both information flow and material flow, along with the time and effort required at each stage.
Unlike BPMN or swimlanes that focus on what happens, VSM focuses on how long it takes and where value gets stuck. This makes it particularly powerful for identifying processes for automation in operational environments.
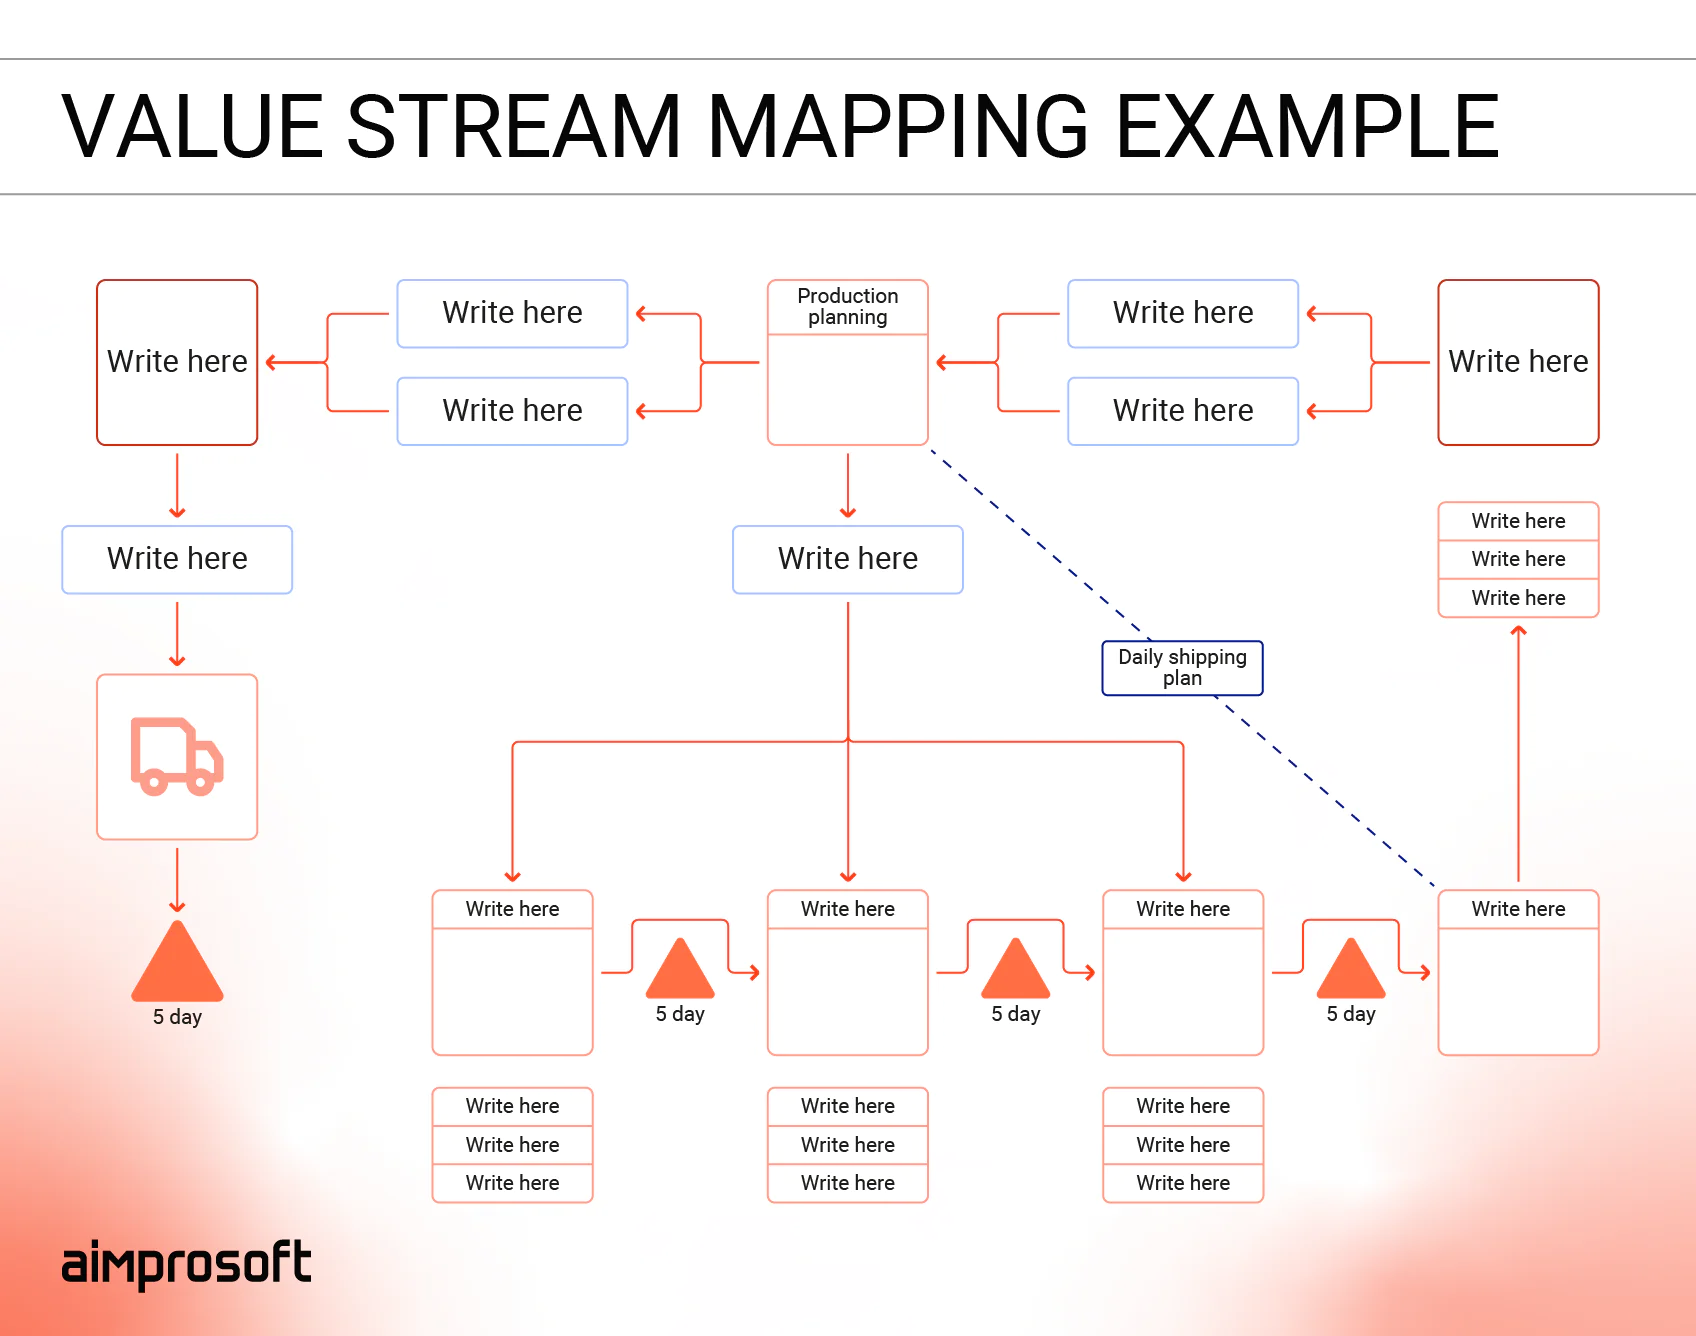
Key elements VSM reveals:
- Cycle time – How long each step actually takes to complete.
- Wait time – Where work sits idle between steps.
- Value-add vs. non-value-add activities – What customers actually pay for versus internal overhead.
- Inventory/backlog buildup – Where bottlenecks create delays.
A typical VSM exercise might reveal that an order-fulfillment process has 2 hours of actual work but 3 days of total cycle time due to approvals, system delays, and handoffs. This insight immediately highlights the best processes to automate first — those non-value-add activities creating the longest delays.
Regardless of which mapping approach you choose, the goal remains the same: create visibility before automation. With clear process documentation in hand, you’re ready to move to the next critical step — evaluating which mapped processes are actually ready for automation.
Core criteria to evaluate if a process is automation-ready
Now that you know what processes your workflows contain you can step up to validating which one requires automation. Just a reminder: the most visible processes don’t always provide the biggest impact. This checklist will help you keep everything under control.
These criteria also support a structured process assessment for automation — in other words, a repeatable automation decision framework that keeps your team from automating the wrong things.
Technical readiness criteria
| Criterion | Explanation | Example | Scoring |
| Repeatable and rules-based | Processes that follow consistent, predictable steps are easiest to automate | Invoice approvals that always require the same checks | 1 = highly variable, 5 = fully standardized |
| High volume or frequency | Process occurs regularly with sufficient volume to justify automation investment | Customer onboarding handling 50+ new clients monthly | 1 = rare/occasional, 5 = daily/high volume |
| Prone to manual error | Work that involves repetitive data entry or complex calculations benefits most from automation | Entering purchase orders into ERP systems | 1 = few/no errors, 5 = frequent costly errors |
Technical readiness subtotal: ___/15
Business impact criteria
| Criterion | Explanation | Example | Scoring |
| Time-sensitive | Process has tight deadlines or time constraints that affect business performance | Regulatory reporting with fixed submission deadlines | 1 = no urgency, 5 = critical deadlines |
| Customer experience impact | Process directly affects customer satisfaction, response times, or service quality | Support ticket routing and initial response automation | 1 = low/no impact, 5 = high customer visibility |
| Audit/compliance necessity | Process requires detailed tracking, approval chains, or regulatory documentation | KYC checks in banking or healthcare record management | 1 = not compliance-related, 5 = high compliance dependency |
Business impact subtotal: ___/15
Implementation feasibility criteria
| Criterion | Explanation | Example | Scoring |
| Process standardization | How consistent is the process across teams, locations, or departments | Standardized procurement workflow vs. ad-hoc purchasing | 1 = inconsistent, 5 = fully standardized |
| Data quality & availability | Quality and accessibility of data inputs required for automation | Clean, structured data vs. scattered spreadsheets | 1 = unstructured/siloed, 5 = high-quality/accessible |
Implementation feasibility subtotal: ___/10
Now let’s see how this framework works in practice. Take monthly invoice processing in a mid-size company. Each month, the accounting team handles 180+ vendor invoices. Every invoice arrives via email or mail, is manually entered into a spreadsheet, routed to department managers for approval, and finally processed for payment. The whole cycle takes 5-8 business days, and errors in data entry or delays in chasing approvals are common.
Technical readiness scoring:
- Repeatable and rules-based: 5/5 – Every invoice follows identical steps: receive → enter data → route for approval → process payment → file.
- High volume or frequency: 5/5 – 180 invoices monthly (roughly 9 per business day) with consistent volume year-round.
- Prone to manual error: 4/5 – Regular typos in spreadsheet entry, occasional duplicate payments, missed approval deadlines.
Technical readiness subtotal: 14/15
Business impact scoring:
- Time-sensitive: 3/5 – 30-day payment terms matter for vendor relationships, but not critical deadlines.
- Customer experience impact: 2/5 – Affects vendor relationships and internal team efficiency, but not customer-facing.
- Audit/compliance necessity: 4/5 – Detailed audit trail required for financial reporting and tax purposes.
Business impact subtotal: 9/15
Implementation feasibility scoring:
- Process standardization: 5/5 – Identical process across all departments and invoice types.
- Data quality & availability: 3/5 – Mix of PDF invoices, email attachments, and some paper invoices; vendor data exists but scattered.
Implementation feasibility subtotal: 8/10
Total Score: 31/40
Okay, and what does this mean?
Invoice processing is a strong automation candidate: standardized, error-prone, and high-volume with compliance needs. Despite some data quality challenges, it’s a process that should be prioritized early, since automation will quickly reduce errors, shorten cycle times, and free the accounting team for higher-value work.
This is where a professional services automation for small business solution or custom-built automation processes can transform operations, cutting delays without losing control.
Making sense of your scores
Once you’ve applied the scoring to your own processes, here’s how to interpret the totals:
Processes scoring 30-40 points are your automation “home runs” — they’re practically begging to be automated. These typically combine high business impact with straightforward technical implementation. Think of standardized invoice processing in a growing company: high volume, rule-based, error-prone when done manually, and directly affects vendor relationships. When you find these processes, move quickly. They often deliver ROI within months and build momentum for your broader automation of business processes program.
Processes in the 20-29 range represent solid automation opportunities that should be planned for the next 6-12 months. They might score high on business impact but need some process standardization first, or they could be technically ready but require more careful change management due to customer-facing elements. These are your “strategic wins” — worth the investment but requiring more thoughtful implementation. At this stage, many companies lean on business process automation consulting or a trusted business automation consultant to align teams and manage expectations.
Scores of 15-19 points signal processes that need work before automation makes sense. Perhaps the workflow varies significantly between departments, or the data quality issues would undermine automation effectiveness. Don’t abandon these processes — instead, treat the low score as a roadmap for improvement. Address the weak areas first, then re-check against your automation readiness checklist or other business process evaluation criteria in 6–12 months.
Turning scores into action
Scoring shows you where each process stands, but the real value comes when you turn those scores into priorities. Not every process can or should be automated at once. That’s where a simple prioritization matrix helps you decide where to start.
The vertical axis shows business impact (low to high), and the horizontal axis shows implementation complexity (low to high). Once plotted, it’s easy to see which processes to prioritize.
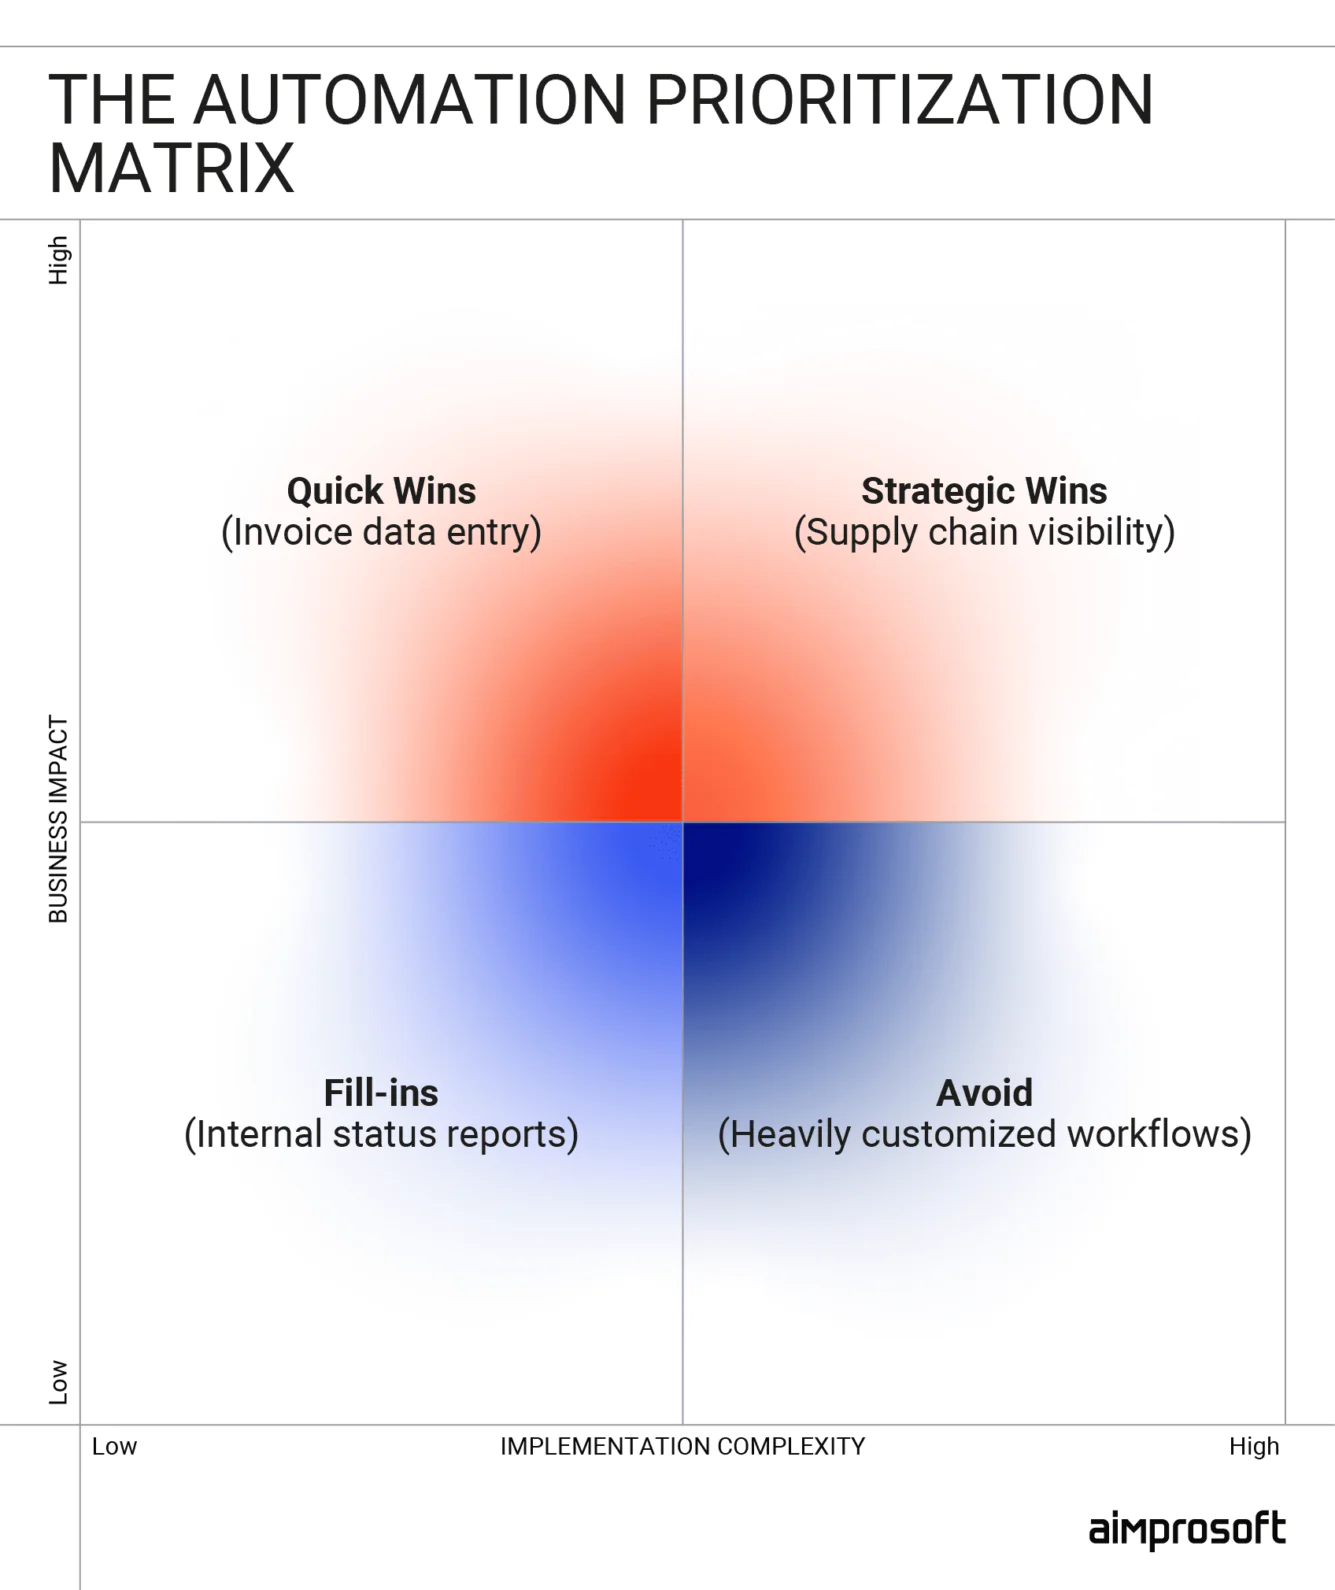
- Quick wins (high impact, low complexity): Processes that are highly standardized, high-volume, and error-prone but require minimal restructuring. Examples: invoice data entry, employee onboarding forms, payroll calculations, automated email responses. Start here first — they deliver ROI within 2-4 months and build internal confidence in the automation of business processes.
- Strategic wins (high impact, high complexity): Processes that deliver transformative benefits but demand significant investment in time, training, or technology. Examples: supply chain visibility, end-to-end order fulfillment, AI automation business opportunities in compliance, and customer service workflows. Plan for 6-12 months with proper stakeholder alignment and dedicated project management.
- Fill-ins (low impact, low complexity): Processes that are easy to automate but don’t significantly improve operations. Examples: internal status reporting, simple data syncs, basic file transfers, routine notifications. These are often good starting points for automation for small business owners testing the waters, but automate only when you have spare resources — don’t let these tasks interfere with how to prioritize automation for higher-impact opportunities.
- Avoid (low impact, high complexity): Processes that are inconsistent, rarely used, or highly customized but technically demanding. Examples: one-off approvals, legacy system integrations, department-specific workarounds, edge-case exceptions. These require careful process discovery for automation and process selection for automation. Don’t automate until you standardize these processes first — otherwise you’ll just automate dysfunction.
This quadrant takes the guesswork out of workflow automation prioritization. Instead of chasing the loudest problems, leaders can visualize which processes will deliver the best mix of ROI and feasibility. Quick wins build trust and confidence, while strategic wins align with long-term transformation goals.
But remember that even the highest-scoring processes need team buy-in to succeed. The most technically sound automation can fail if users aren’t prepared for workflow changes. Smart leaders evaluate business processes for automation with equal attention to technical feasibility and user readiness. This means involving process stakeholders in evaluation, communicating benefits clearly, and planning adequate training time. When teams understand how automation will make their work easier rather than threaten their roles, adoption becomes an asset rather than an obstacle.
Summing up
By now, you’ve mapped your workflows, scored them against clear criteria, and plotted them on a prioritization matrix. That means you’re no longer asking if automation is worth it, you can see where it will make the biggest impact.
The next move is yours. You can start small by piloting one or two quick wins and watching the ROI appear within months. Or you can look further ahead, using the scores and insights to plan strategic automation initiatives that reshape how your business operates.
And you don’t have to figure it out alone. Whether you need help validating your process scores, creating a roadmap, or running the first pilot, our business process automation consulting and business automation services are designed to support you at every stage.
Download the worksheet for the first 30 of action plan to start scoring your processes today — or contact our team, and we’ll guide you through the evaluation together.